
Amazon logoAmazon Externship via Extern
Graeme Cyrell portrait

Data Analyst

I'm Graeme Cyrell, on a journey to shape my career in data analytics with hands-on experience at Beats by Dre.

Work samples

Here, you'll find my projects and experiences that showcase my passion for data analysis and insights.

  • Walmart Sales Performance Dashboard

    Nov 2026

    Walmart Sales Performance Dashboard

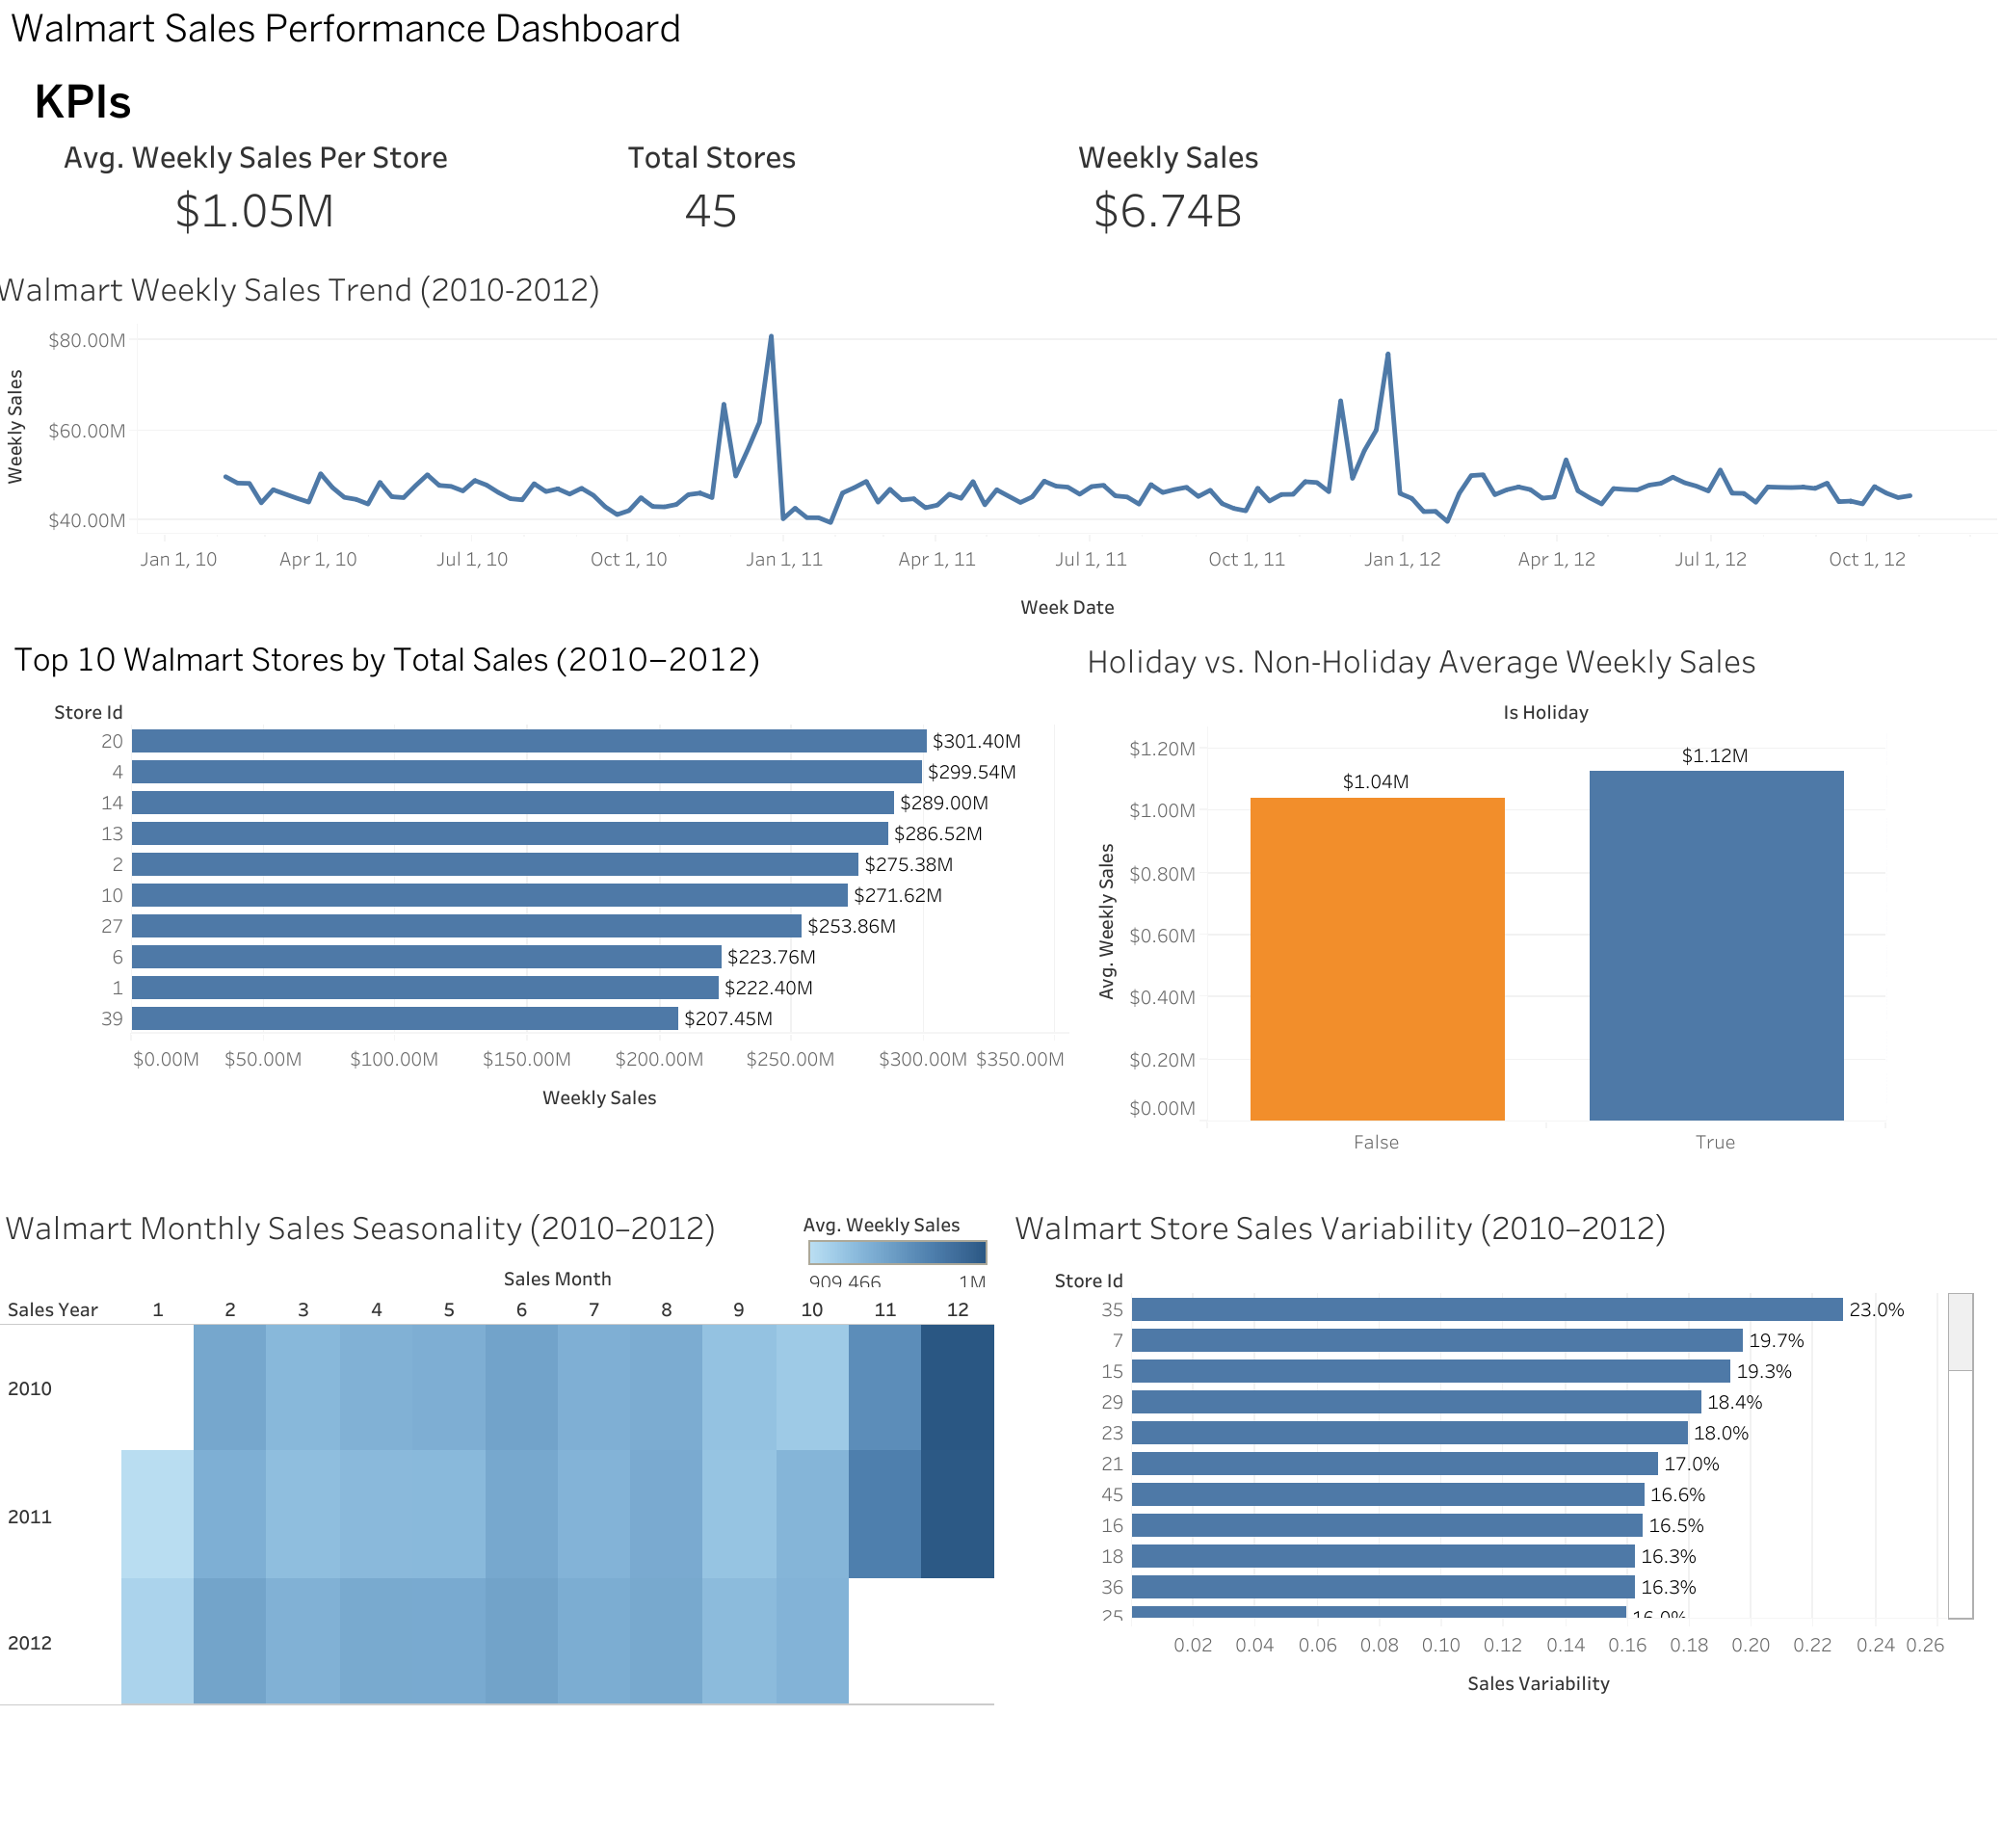
    Analyzed historical Walmart sales data covering 45 stores, 6,435 records, and 143 weeks between February 2010 and October 2012. The project's objective was to identify store performance differences, weekly sales trends, seasonal demand, holiday sales patterns, and sales variability. Using Google Big

    SQLTableauData AnalysisData CleaningData ManipulationKPI Dashboard

About me

I'm Graeme Cyrell, on a journey to shape my career in data analytics with hands-on experience at Beats by Dre.

I'm Graeme Cyrell Siazon-Consolacion, an aspiring data analyst currently engaged in an externship with Beats by Dre and Amazon Fufillment. I'm passionate about leveraging both qualitative and quantitative insights to drive impactful decisions in the industry.

Externships

Amazon Operational Strategy & People Analytics Externship

In progress

Experience

Small Business Owner

Amazon · Dec 2022 - Aug 2024

PT Tech

Stratton Rehab. Clinic · Jun 2021 - Sep 2022

Education

Texas A&M International University

Master of Science, Information Science (IT/Computer Science) · Class of 2025

University of Texas at San Antonio

Bachelors Degree/Kinesiology · Class of 2021

Skills

Data AnalyticsQualitative AnalysisQuantitative AnalysisInsights GenerationAISQLExcelTableauData AnalysisData StorytellingData VisualizationData ManipulationData InsightsData CleaningData QualityPython(Familiar)CommunicationTrend Identification

✅ Verified by Extern

Beats by Dre Data Analytics: Qualitative & Quantitative Insights Externship

A Beats by Dre externship in data analytics focused on extracting qualitative and quantitative consumer insights from reviews, surveys, and social data.

Data AnalysisPython
Overview

In my externship with Beats by Dre, I explored how top brands decode consumer conversations to enhance product resonance. I gained practical skills in market trend identification, customer feedback analysis, and sentiment analysis using Python and AI tools. This experience deepened my understanding of consumer behavior and data analytics, guiding strategic business decisions.

Beats by Dre Data Analytics: Qualitative & Quantitative Insights Externship
Google Slides
Access

What I've accomplished

I produced a pain-point taxonomy, a CSV-formatted customer journey map, cleaned survey datasets with statistical analyses and charts, and a documented approach for aspect-level sentiment tagging and competitive sentiment benchmarking.

Project breakdown

View all work
Back to work

Walmart Sales Performance Dashboard

Analyzed historical Walmart sales data covering 45 stores, 6,435 records, and 143 weeks between February 2010 and October 2012. The project's objective was to identify store performance differences, weekly sales trends, seasonal demand, holiday sales patterns, and sales variability. Using Google Big

SQLTableauData AnalysisData CleaningData ManipulationKPI Dashboard

Overview

Analyzed historical Walmart sales data covering 45 stores, 6,435 records, and 143 weeks between February 2010 and October 2012. The project's objective was to identify store performance differences, weekly sales trends, seasonal demand, holiday sales patterns, and sales variability. Using Google BigQuery, SQL, and Tableau, I transformed raw retail data into meaningful insights that could support i

Walmart Sales Performance Dashboard

What I've accomplished

Performed end-to-end data cleaning and analysis using SQL in Google BigQuery. Validated data quality, checked for missing values and duplicates, standardized data formats, and created a cleaned dataset for analysis. Developed SQL queries to answer five business questions related to store rankings, weekly sales, holiday performance, monthly seasonality, and sales variability. Built an interactive T

Outcome

Analyzed approximately $6.74 billion in historical sales, identifying Store 20 as the highest-performing location with $301.40 million in cumulative sales. Found that holiday weeks generated 7.84% higher average weekly store sales compared with non-holiday weeks, while December consistently showed strong seasonal demand. Identified Store 35 as having the highest relative sales variability at 22.97

View all work

✅ Verified by Extern · ⏱️ In progress

Amazon Operational Strategy & People Analytics Externship

Imagine shaping how AMAZON — yes, THE Amazon — welcomes and keeps its workforce. Every year, Amazon loses billions because new hires leave before Day 90. You’re going to fix that. In this externship, you’ll web scrape real-world employee reviews from across the web, extract actionable insights, and design persona-driven strategies to help Learning Ambassadors connect smarter, faster, and more humanely. It’s part research, part strategy—and all about learning how people data drives big decisions.

Data AnalysisPythonStrategyOperations

Overview

The externship examined how operational practices and workforce sentiment interact in Amazon fulfillment centers. The work combined web-scraped employee reviews with qualitative and quantitative analysis to surface patterns in early-tenure turnover. Deliverables included extracted insights and persona-driven recommendations based on employee feedback and operational context.

Amazon Operational Strategy & People Analytics Externship

What I've accomplished

I produced a role-by-role spreadsheet that mapped AFC responsibilities, collaborators, and systems, and used it alongside employee-review analysis to surface patterns in early-tenure turnover.

Project breakdown

The project mapped AFC roles and responsibilities, listed who each role worked closely with, and noted common tools and operational notes. The deliverable produced a role-by-role spreadsheet showing responsibilities, collaborators, and systems used.

Google Sheets
Access

I reviewed Glassdoor feedback, extracted 6 positive and 6 negative examples, noted recurring themes (management issues, pay/benefits, scheduling), and summarized observations linking specific review text to each theme.

Google Docs
Access

I merged cleaned Glassdoor and YouTube records, added sentiment polarity/subjectivity and labels, and produced side-by-side charts and keyword summaries to compare tone and recurring themes across platforms.

Google Sheets
Access

I identified three themes from 32 reviews, tagged each item by theme and sentiment, compiled representative quotes, and produced a summary table showing counts and platform breakdowns, finding most mentions were negative and physical exhaustion was the most frequent issue.

Google Sheets
Access
View all work