

ARCeH logoCurrently an Extern @ARCeH
Kimberly Aron portrait

Data Analytics Enthusiast in Healthcare

I'm Kimberly, a Data Analytics M.S. candidate dedicated to transforming healthcare operations through data-driven insights. Let's innovate together!

Work samples

Discover my work in data analytics, featuring projects in SQL, Tableau, and Excel that showcase my skills and commitment.

  • Visualizing Bitcoin Price Trends and Market Volatility
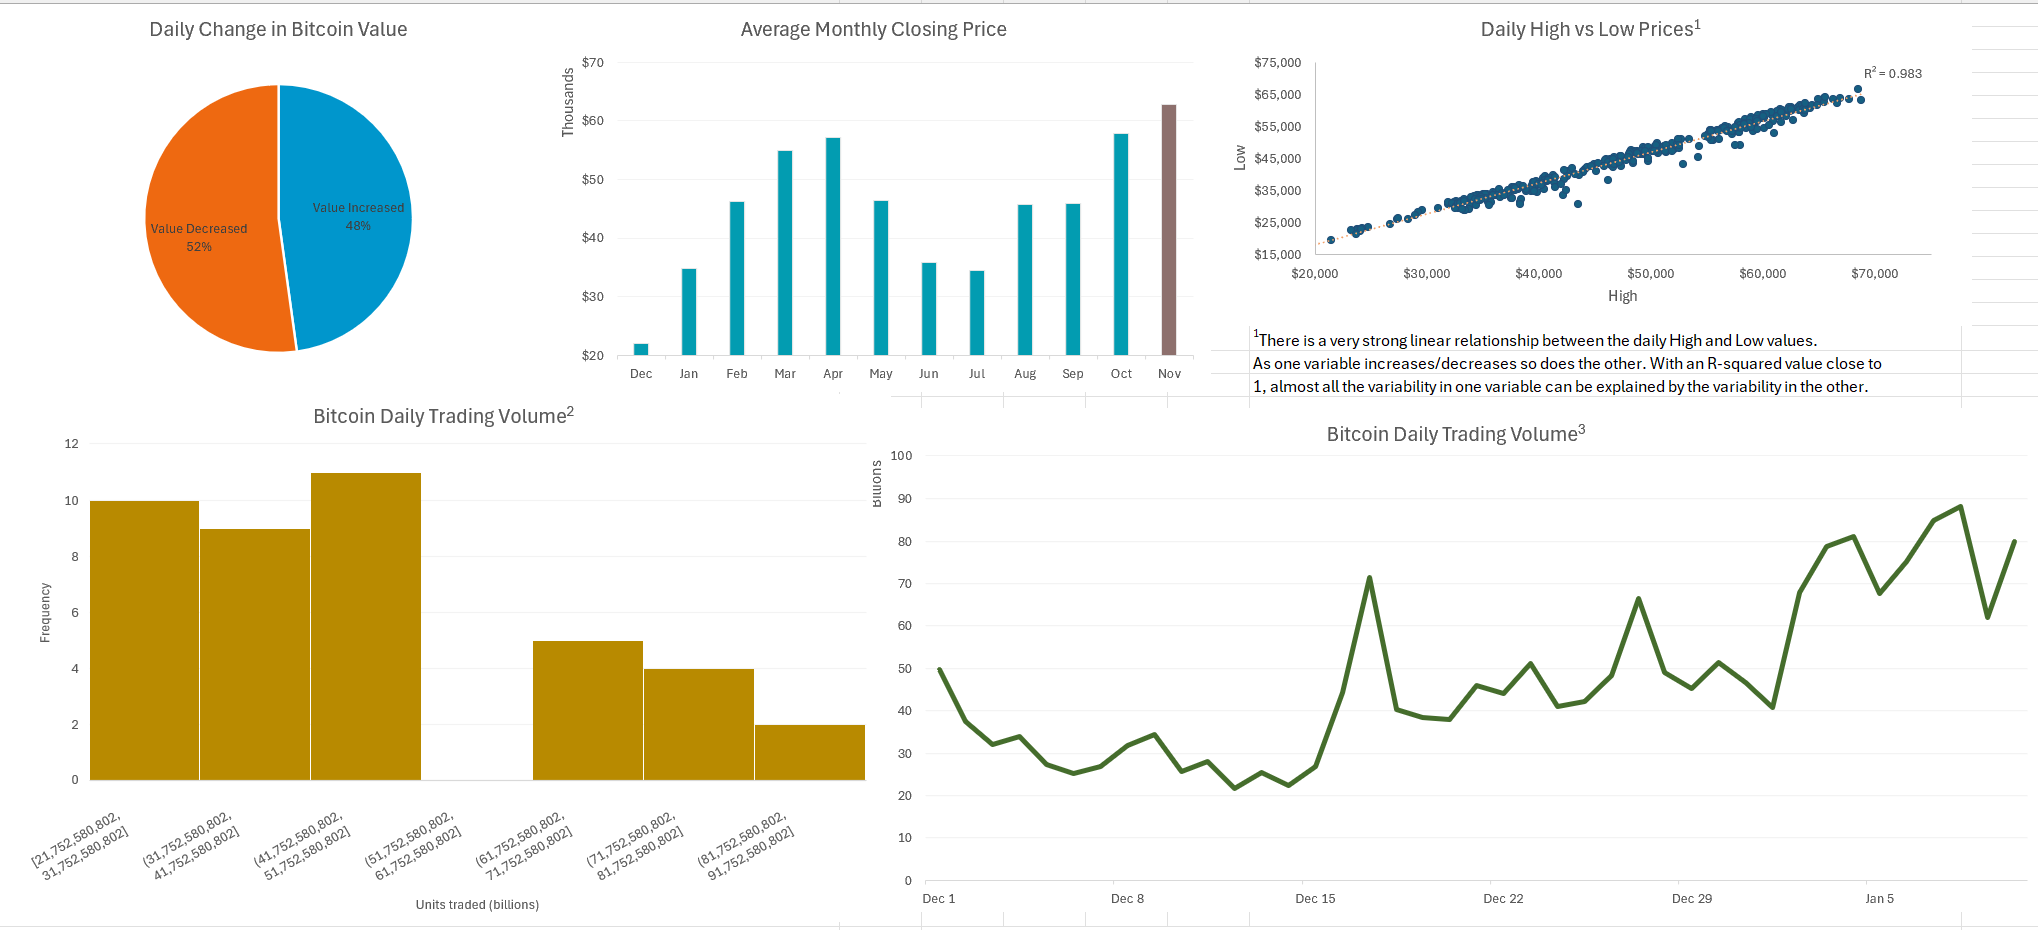
    Visualizing Bitcoin Price Trends and Market Volatility

    This project analyzes Bitcoin’s historical market behavior using Kaggle cryptocurrency data to separate long-term trends from short-term volatility. Excel analysis found a strong relationship between daily highs and lows (R² = 0.983). Despite rising from $30K to over $60K, Bitcoin closed lower on 52

    Excel
  • When and where did most COVID deaths occur?
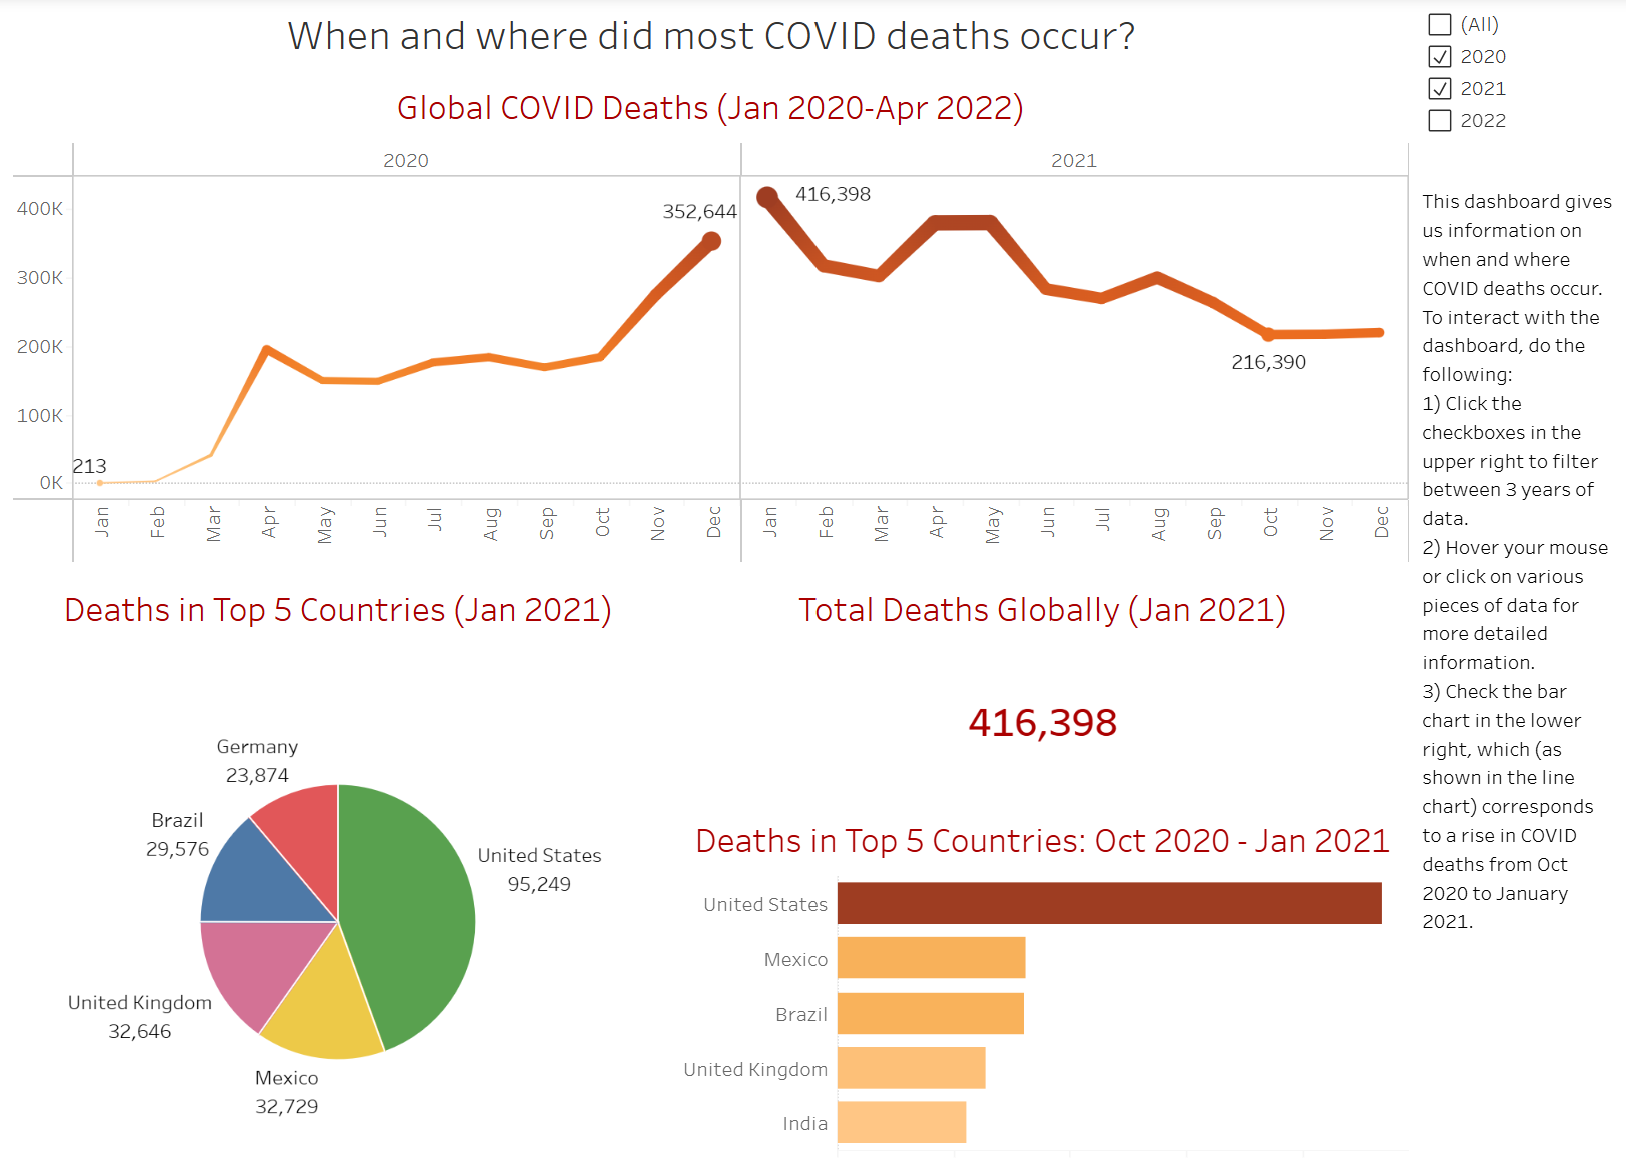
    When and where did most COVID deaths occur?

    This project uses Tableau to analyze global COVID-19 death trends and show how the pandemic affected regions over time. An interactive dashboard allows users to filter by country, region, and time period to compare trends. Maps, time-series charts, and key metrics such as total deaths and death rate

    Tableau

About me

I'm Kimberly, a Data Analytics M.S. candidate dedicated to transforming healthcare operations through data-driven insights. Let's innovate together!

I am an M.S. Data Analytics candidate with a background in healthcare operations, cross-functional communication, customer service, and managing sensitive client data. I have skills in Excel, SQL, Tableau, process improvement, and profesional communication in team environments. Additionally, I am proficient in Mandarin Chinese, which enables me to effectively support global and diverse teams.

Externships

Data Analytics, Health Outcomes Externship with ARCeH

ARCeH

Experience

Member Experience Manager

Weekend Health · Jan 2024 – Feb 2025

Health Coach

Noom Inc. · Sep 2019 – Nov 2022

Education

Eastern University

MS, Data Analytics · Class of 2027

University of Wisconsin-Madison

Transfer Credit, Business Analytics

University of Florida

BS, Family, Youth and Community Sciences

Skills

ExcelTableauPythonSQLProcess improvementData visualizationBusiness intelligenceCustomer serviceDatabase maintenanceHealthcare data managementDocumentationMicrosoft OfficeAttention to detailCross-functional communication

When and where did most COVID deaths occur?

This project uses Tableau to analyze global COVID-19 death trends and show how the pandemic affected regions over time. An interactive dashboard allows users to filter by country, region, and time period to compare trends. Maps, time-series charts, and key metrics such as total deaths and death rate

Tableau

Overview

This project uses Tableau to analyze global COVID-19 death trends and show how the pandemic affected regions over time. An interactive dashboard allows users to filter by country, region, and time period to compare trends. Maps, time-series charts, and key metrics such as total deaths and death rates make complex data easier to explore and highlight areas of greater severity.

When and where did most COVID deaths occur?

What I've accomplished

https://public.tableau.com/app/profile/kimberly.aron/viz/CovidDeathsExploration/CovidDeathsDashboard

View all works

✅ Verified by Extern · ⏱️ In progress

Data Analytics, Health Outcomes Externship with ARCeH

Here’s what the data says: put a pin in Bangkok. Draw a five-hour flight radius around it. You just circled half the world's population. And half of those people are kids under five, an age where survival itself isn't guaranteed. Five isn't an arbitrary number: it's the line researchers use as a proxy for a country's overall health, because almost every preventable childhood death, driven by a bad water source, poor air quality, or an infection nobody caught in time, happens before it. Clear five, and the odds of reaching adulthood jump astronomically. Don't, and the cause almost always traces back to poverty, healthcare access, environmental risk, or nutrition, something that could have been mapped, measured, and prevented in time. That's the gap this externship exists to close: turning scattered, messy public data into a specific, defensible answer about what's actually driving that risk in a given place, and pass it to the people at ARCeH who want to know about it.

Data AnalysisData VisualizationData Storytelling

Overview

The externship converted public health, environmental, and demographic data into an analytic foundation for understanding under-five mortality drivers in the Bangkok region. The work reviewed data sources and analytical limits, defined suitable correlational approaches, and produced a structured plan for measuring associations between environmental, access, and nutrition indicators and child

Data Analytics, Health Outcomes Externship with ARCeH

What I've accomplished

I framed the analytical scope and constraints, clarifying which questions the available data could answer and which required different methods or data sources.

Project breakdown

View all works