Amazon logoAmazon Externship via Extern
Omer Ahmad Sayed portrait

Data Analyst | Power BI, SQL, Python, Excel | PL-300 Certified

Clear dashboards. Real insights. Smarter decisions. Open to Data Analyst roles across the UAE.

Work samples

Real projects where I clean, model, and visualise data with Power BI, SQL, Python, and Tableau, turning raw numbers into clear business answers.

  • Tailwind Traders Sales & Profit Dashboard

    Apr 2026

    Tailwind Traders Sales & Profit Dashboard

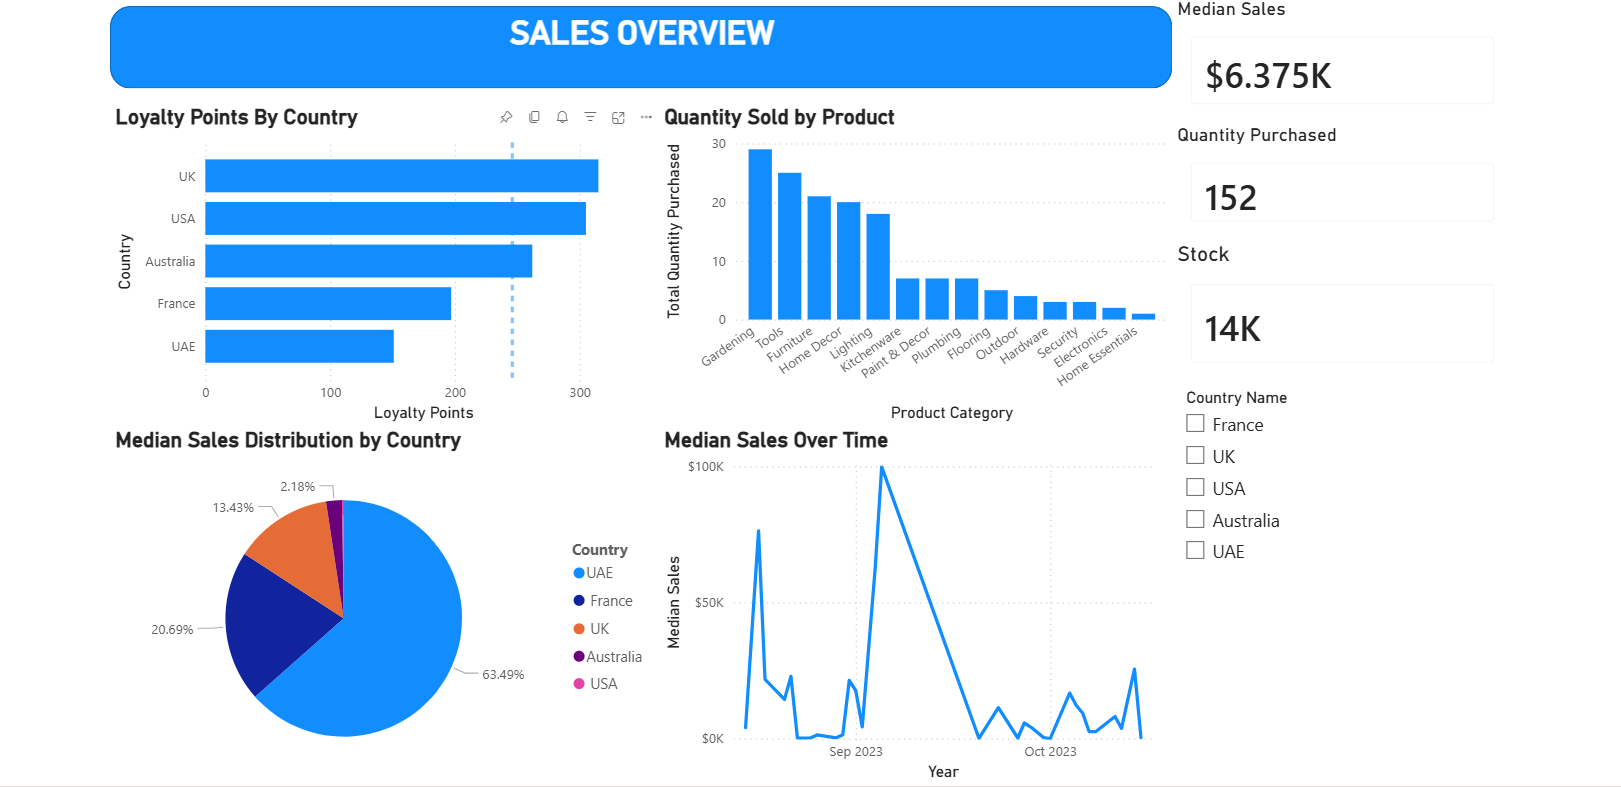
    Tailwind Traders is a global retailer selling across several countries and currencies. Leaders needed one place to see sales and profit clearly, without converting numbers by hand. I built a multi-page Power BI executive dashboard that brings everything together in a single, easy-to-read view.

    Power BIPower QueryDAXPythonData Modeling
  • Bellabeat Fitness Case Study

    Mar 2026

    Bellabeat Fitness Case Study

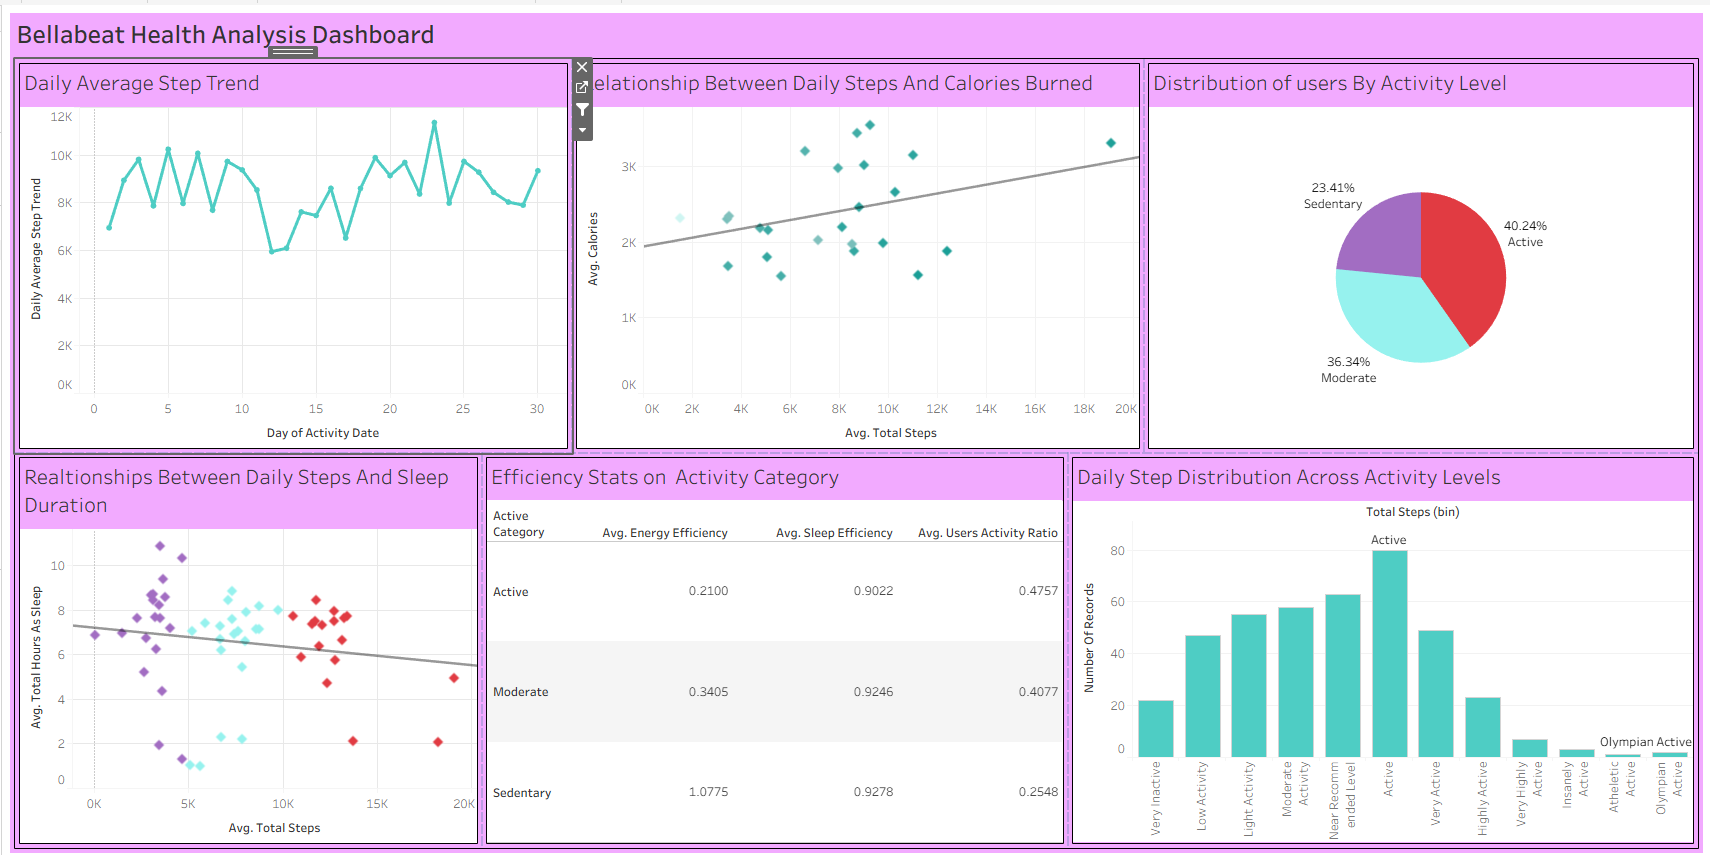
    Bellabeat makes health-focused smart devices for women and wanted to know how people actually use fitness trackers. I analysed 940K+ Fitbit activity records to uncover usage patterns and turn them into insights that could shape Bellabeat’s marketing strategy.

    TableauSQLMicrosoft Excel

About me

Clear dashboards. Real insights. Smarter decisions. Open to Data Analyst roles across the UAE.

I’m Omer, a Dubai-based Data Analyst who enjoys finding the “why” behind the numbers. Since graduating in Computer Science and Engineering (2025), I’ve earned my Microsoft PL-300 certification and built dashboards and analyses with Power BI, SQL, Python and Excel. Today, I’m part of the Amazon People Analytics Externship, using employee reviews to uncover why new hires leave early and how to keep them longer. My next step is a full-time Data Analyst or BI role in the UAE. I hold a valid UAE visa, and I’m also open to internships.

Externships

Amazon Operational Strategy & People Analytics Externship

In progress

Experience

Operational Strategy & People Analytics Extern

Extern (Amazon-sponsored externship) · Sep 2026 – Present

Education

Allenhouse Institute of Technology (Affiliated to AKTU)

Bachelor of Technology - Computer Science & Engineering · Class of 2025

Skills

Operational strategy conceptsPeople analytics conceptsPower BIExcelDAXPower QuerySQLPythonTableauAWSPowerPointWordData AnalysisData VisualizationStatistical AnalysisDashboardingData cleaningData ModelingAIBusiness Intelligence
Back to work

Tailwind Traders Sales & Profit Dashboard

Tailwind Traders is a global retailer selling across several countries and currencies. Leaders needed one place to see sales and profit clearly, without converting numbers by hand. I built a multi-page Power BI executive dashboard that brings everything together in a single, easy-to-read view.

Power BIPower QueryDAXPythonData Modeling
Overview

Tailwind Traders is a global retailer selling across several countries and currencies. Leaders needed one place to see sales and profit clearly, without converting numbers by hand. I built a multi-page Power BI executive dashboard that brings everything together in a single, easy-to-read view.

Tailwind Traders Sales & Profit Dashboard

What I've accomplished

- Designed a star-schema data model linking 6 datasets - Cleaned and shaped the data in Power Query - Wrote DAX measures for key KPIs like sales and profit - Automated multi-currency conversion so every country reports in one currency - Added drill-downs to go from a global view to country-level detail

Outcome

The dashboard lets leaders compare sales and profit across countries in seconds instead of juggling separate reports. Building it taught me how a strong data model simplifies DAX and speeds up dashboards, and how to design for executives who want answers at a glance.

View all work
Back to work

Bellabeat Fitness Case Study

Bellabeat makes health-focused smart devices for women and wanted to know how people actually use fitness trackers. I analysed 940K+ Fitbit activity records to uncover usage patterns and turn them into insights that could shape Bellabeat’s marketing strategy.

TableauSQLMicrosoft Excel

Overview

Bellabeat makes health-focused smart devices for women and wanted to know how people actually use fitness trackers. I analysed 940K+ Fitbit activity records to uncover usage patterns and turn them into insights that could shape Bellabeat’s marketing strategy.

Bellabeat Fitness Case Study

What I've accomplished

- Cleaned and validated 940K+ records using SQL and Excel - Removed duplicates and fixed inconsistent dates and formats - Explored trends in daily steps, calories burned, and sleep - Compared activity levels across users to find usage patterns - Built Tableau visuals to present the findings clearly

Outcome

The analysis turned raw tracker data into clear marketing recommendations, showing where Bellabeat could better engage users around activity and sleep habits. It taught me how to follow a full analysis process, from asking the right question to presenting insights a business can act on.

View all work
Back to work

Cyclistic Bike-Share Case Study

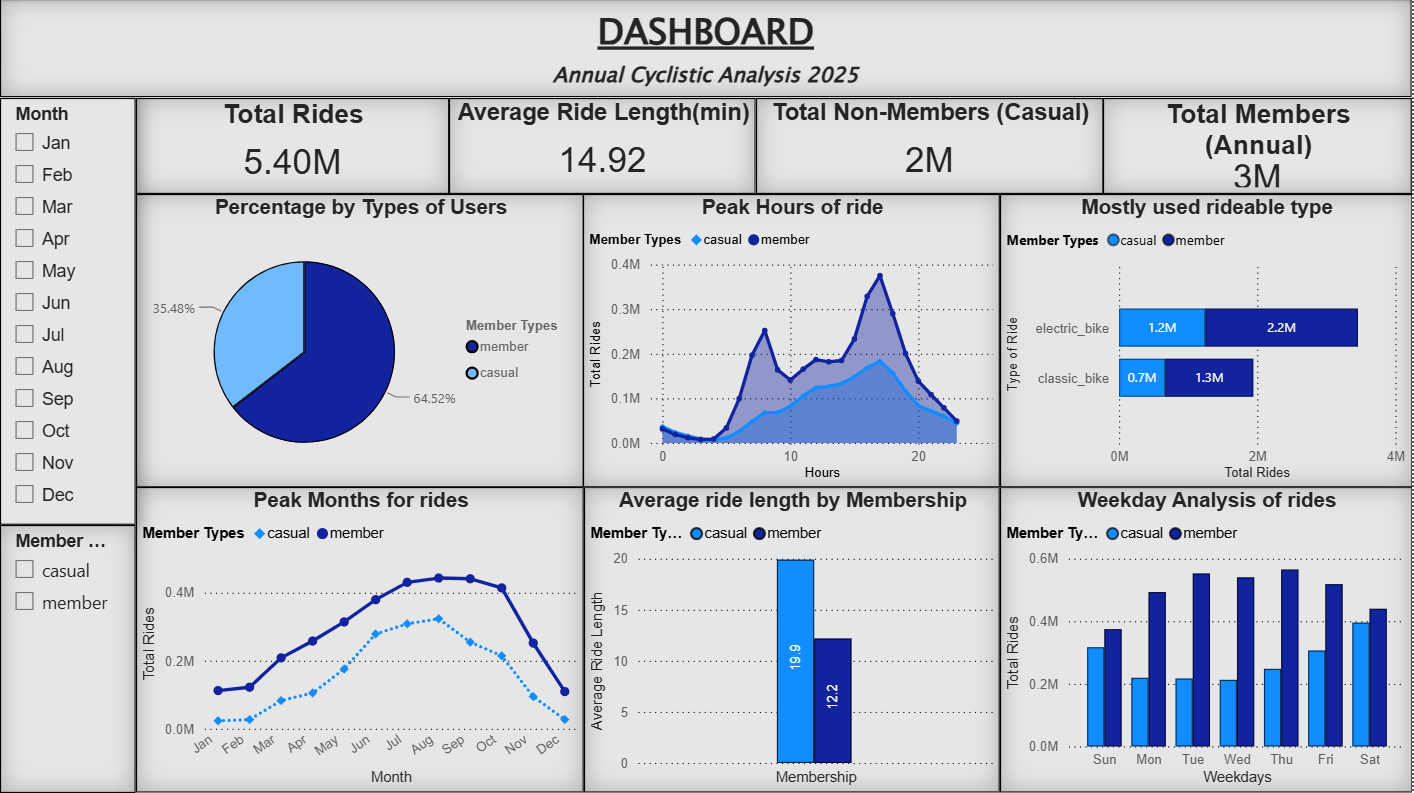
Examined bike-share transactions using R and Power BI to evaluate customer behaviour, usage trends, and membership patterns; conducted customer segmentation and built dynamic Power BI dashboards delivering strategic recommendations.

RPower BIData CleaningData AnalysisData Visualization

Overview

Examined bike-share transactions using R and Power BI to evaluate customer behaviour, usage trends, and membership patterns; conducted customer segmentation and built dynamic Power BI dashboards delivering strategic recommendations.

Cyclistic Bike-Share Case Study

What I've accomplished

- Combined and cleaned 5M+ ride records using R - Created new fields like ride length and day of the week - Removed invalid rides, such as negative or zero durations - Compared casual riders and members by time, day and duration - Built Power BI visuals to present the findings clearly

Outcome

The analysis showed clear differences in how casual riders and members use Cyclistic, giving the marketing team a data-backed starting point for converting casual riders into members. It was my first time handling millions of rows, and it taught me how to work with data at scale.

View all work
Back to work

Airbnb Market Analysis

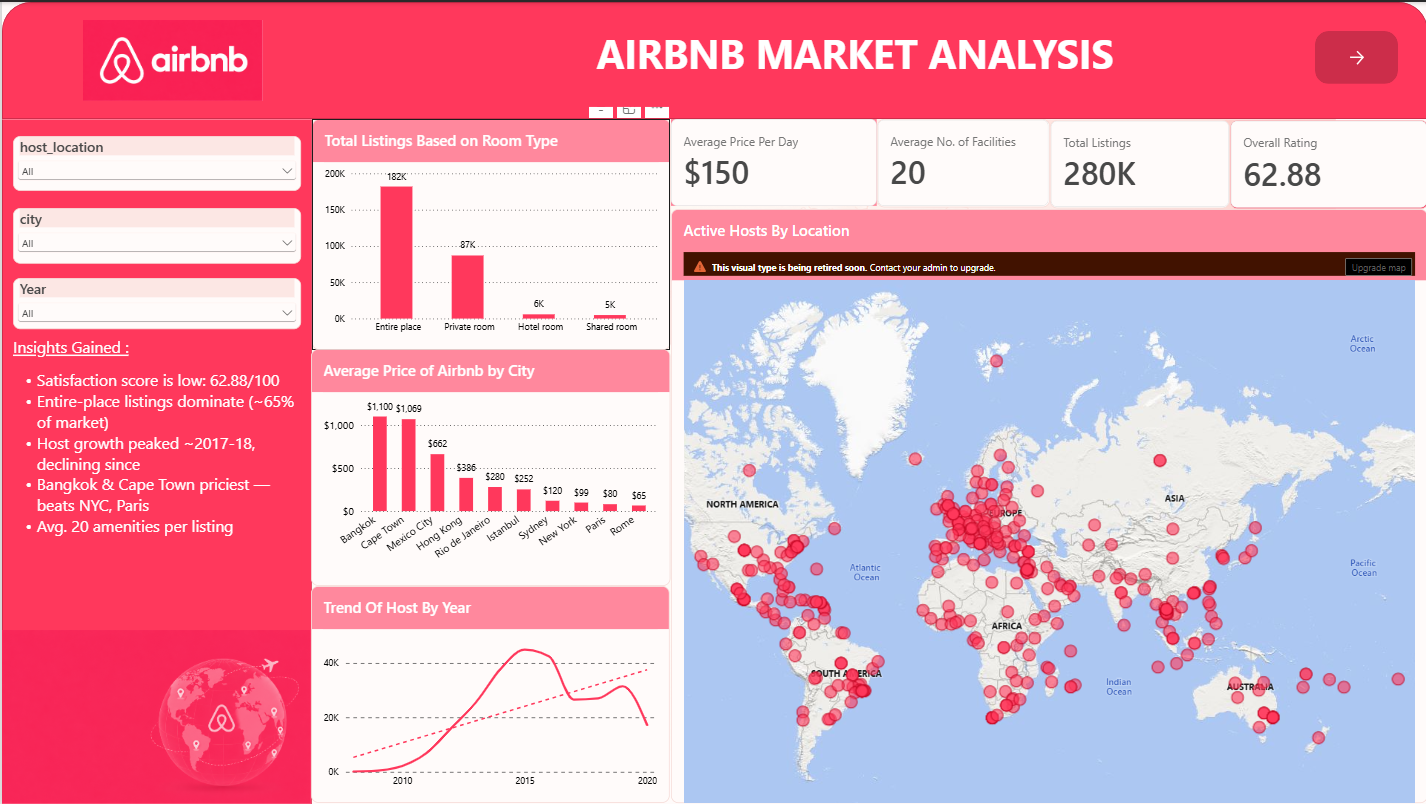
Cleaned 280K listings across 10 cities in MySQL, fixing nulls and blanks and standardising 180+ messy host-location values into country names. Discovered that host communication and cleanliness affect guest ratings the most, and budget listings ($50–100) score higher than luxury ones ($1,000+).

MySQLPower BIDAXData CleaningData Analysis

Overview

Cleaned 280K listings across 10 cities in MySQL, fixing nulls and blanks and standardising 180+ messy host-location values into country names. Discovered that host communication and cleanliness affect guest ratings the most, and budget listings ($50–100) score higher than luxury ones ($1,000+).

Airbnb Market Analysis

What I've accomplished

- Cleaned and prepared the listing data using SQL - Fixed missing values, duplicates, and price formats - Used CTEs and window functions to rank and compare listings - Analysed pricing and reviews by neighbourhood and room type - Identified which listing features link to higher demand

Outcome

The analysis highlighted which areas and property types perform best, giving hosts and investors a clearer picture of where demand and value really are. It sharpened my SQL skills, especially in writing clean, structured queries to answer real business questions.

View all work
Back to work

Dubai Real Estate Market Analysis

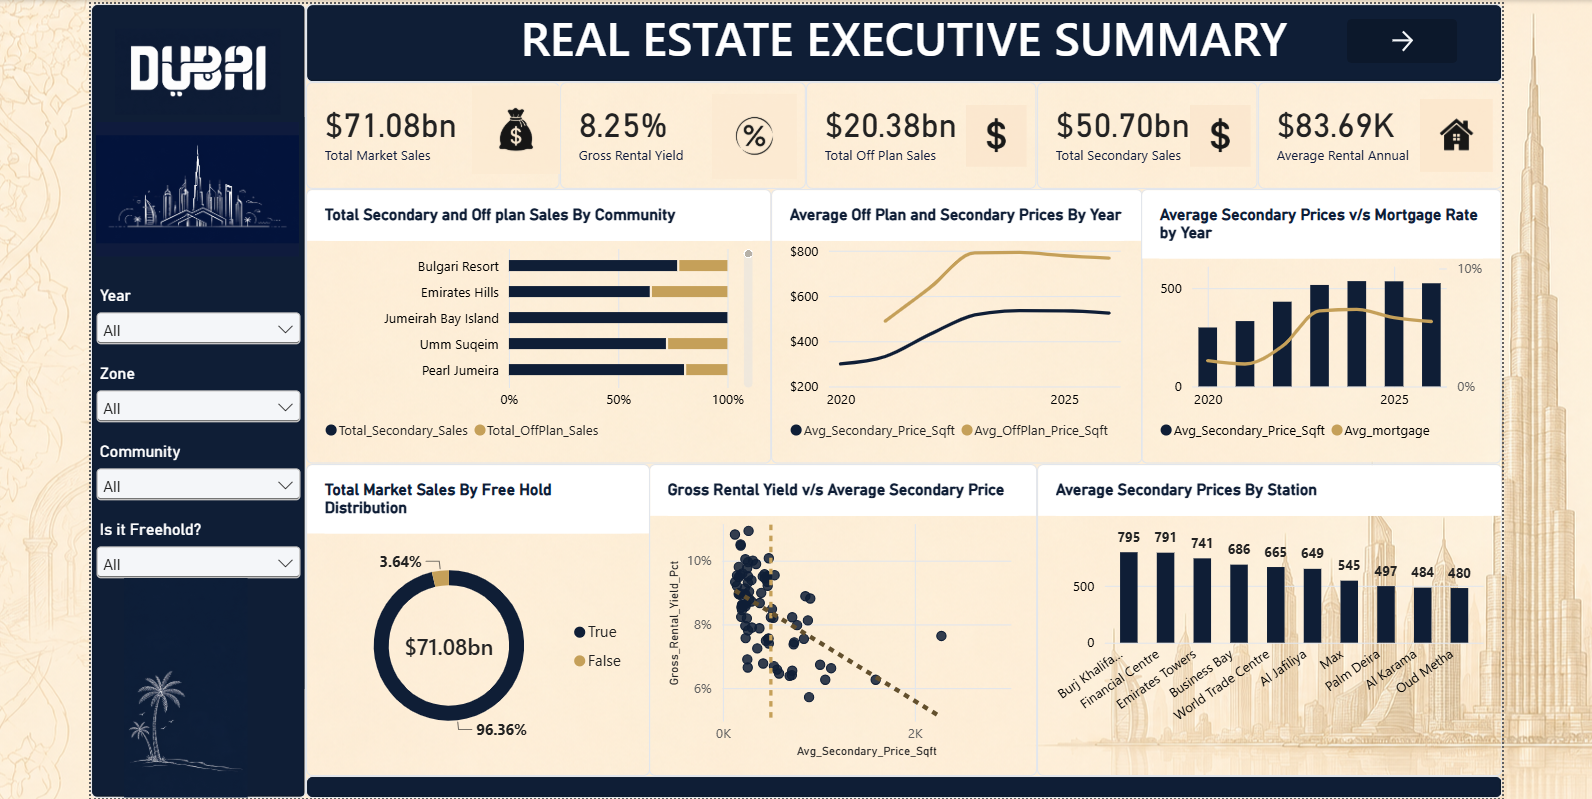
Modelled 93K+ rows from 5 tables (2020–2026) into a star schema in Power BI, after cleaning off-plan, secondary sales and rental data in Excel and Power Query. Identified that properties under $1,000/sq.ft earn 8–12% rental yield vs about 7% for luxury homes, showing mid-priced properties are the be

Power BIDAXPower QueryExcelData AnalysisData Visualization

Overview

Modelled 93K+ rows from 5 tables (2020–2026) into a star schema in Power BI, after cleaning off-plan, secondary sales and rental data in Excel and Power Query. Identified that properties under $1,000/sq.ft earn 8–12% rental yield vs about 7% for luxury homes, showing mid-priced properties are the be

Dubai Real Estate Market Analysis

What I've accomplished

- Cleaned and prepared property data for analysis - Compared prices across key areas and communities - Analysed trends by property type, size, and price per sq ft - Tracked how the market changed over time - Built visuals that make the market easy to understand

Outcome

The analysis gave a clear, data-backed view of Dubai’s property market, showing which areas and property types offer the best value. It also deepened my understanding of a market that matters to many UAE businesses, from brokers to developers.

View all work
Back to work

Airline Passenger Satisfaction Analysis

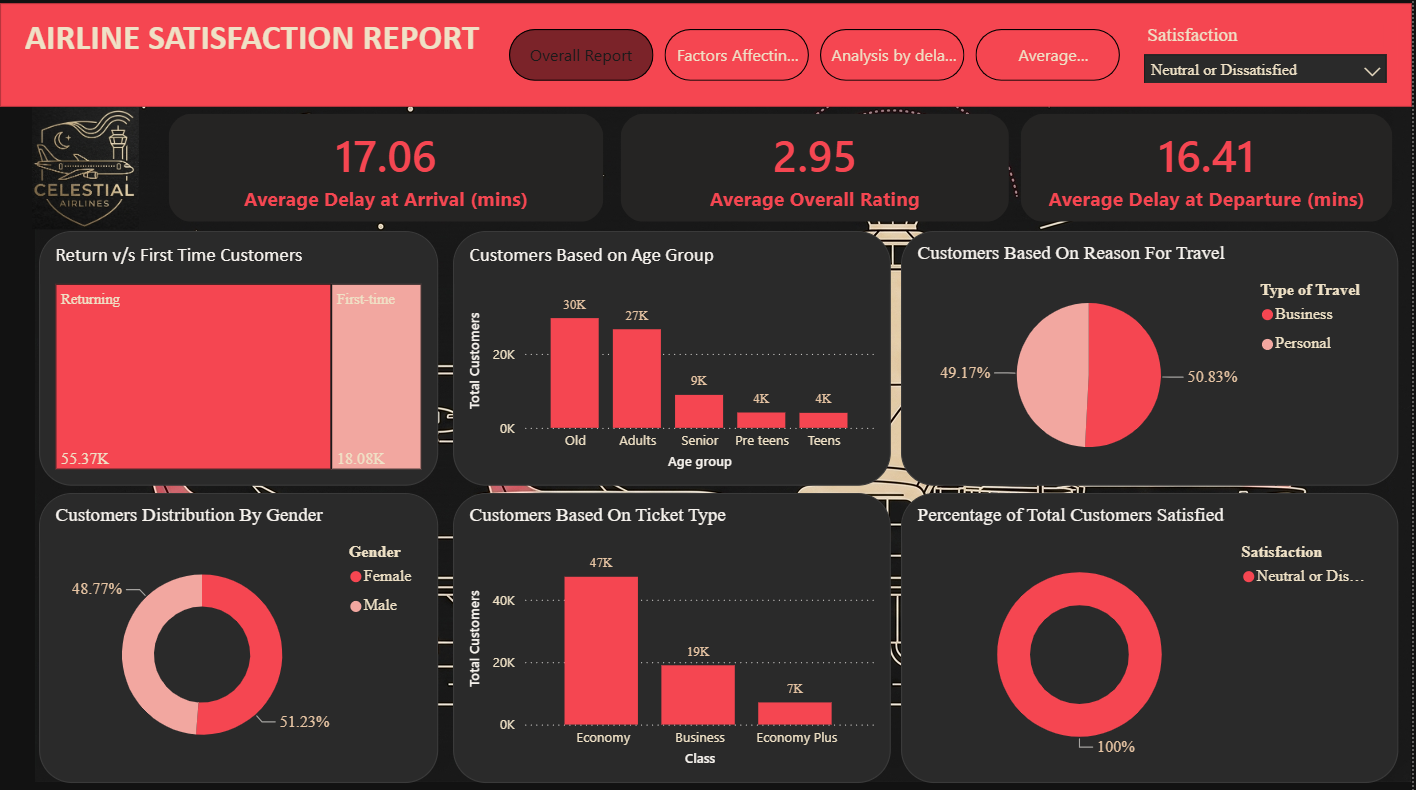
Analysed 129K+ passenger survey responses across 14 service ratings in Power BI to find what drives customer dissatisfaction. Found 57% of passengers were dissatisfied and online services scored lowest (2.91/5 vs 3.42/5 for on-board services); recommended improving online booking and Wi-Fi first.

Power BIPower QueryExcel

Overview

Analysed 129K+ passenger survey responses across 14 service ratings in Power BI to find what drives customer dissatisfaction. Found 57% of passengers were dissatisfied and online services scored lowest (2.91/5 vs 3.42/5 for on-board services); recommended improving online booking and Wi-Fi first.

Airline Passenger Satisfaction Analysis

What I've accomplished

- Cleaned and transformed the survey data in Power Query - Compared satisfied and dissatisfied passengers across key groups - Analysed ratings for services like seat comfort, Wi-Fi and boarding - Broke down satisfaction by travel class and type of travel - Built an interactive Power BI dashboard with filters and KPIs

Outcome

The dashboard pinpointed which services had the biggest impact on satisfaction, giving the airline clear priorities for improvement. It taught me how to turn customer feedback into actionable insights, a skill that applies to any customer-facing industry.

View all work

Global Electronics Retailer Sales Analysis

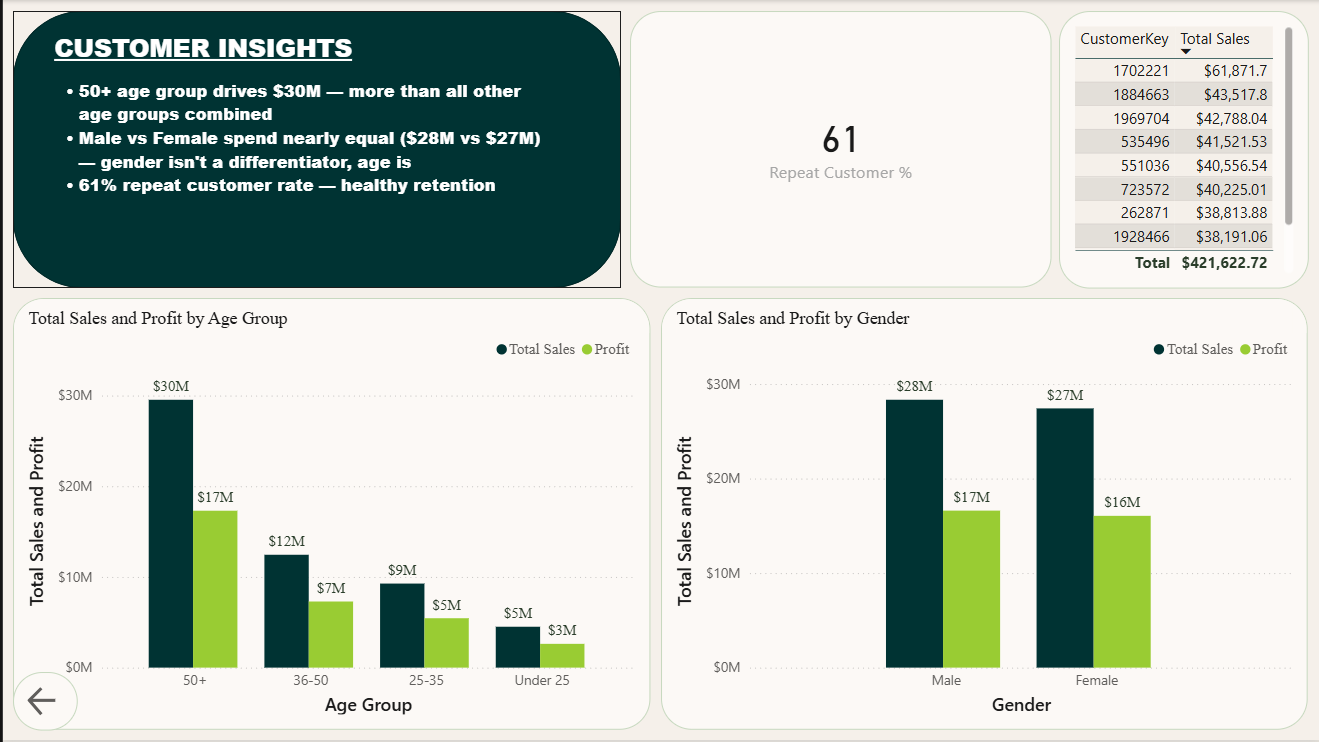
Built an end-to-end Power BI sales report for a global electronics retailer, analysing 62,884 transaction records across 5 linked tables. The goal: turn raw sales data into actionable insights by answering 5 critical business questions on profitability, store performance, customer behaviour, regiona

Power BIFeature EngineeringExcelData ModelingData AnalysisData Visualization

Overview

Built an end-to-end Power BI sales report for a global electronics retailer, analysing 62,884 transaction records across 5 linked tables. The goal: turn raw sales data into actionable insights by answering 5 critical business questions on profitability, store performance, customer behaviour, regional gaps and fulfillment reliability.

Global Electronics Retailer Sales Analysis

What I've accomplished

- Modeled 5 tables (sales, products, customers, stores, exchange rates) into one connected data model - Profitability: pinpointed where high revenue didn’t translate into profit - Store Performance: benchmarked every store with KPI rankings - Geography Gap: mapped regional revenue gaps with interactive map visuals - Fulfillment: measured average delivery days to flag operational bottlenecks

Outcome

Delivered an interactive, decision-ready report with dynamic DAX measures and drill-down visuals, giving stakeholders a single source of truth for 62K+ transactions. Strengthened my skills in data modeling, KPI design and data storytelling.

View all work
Back to work

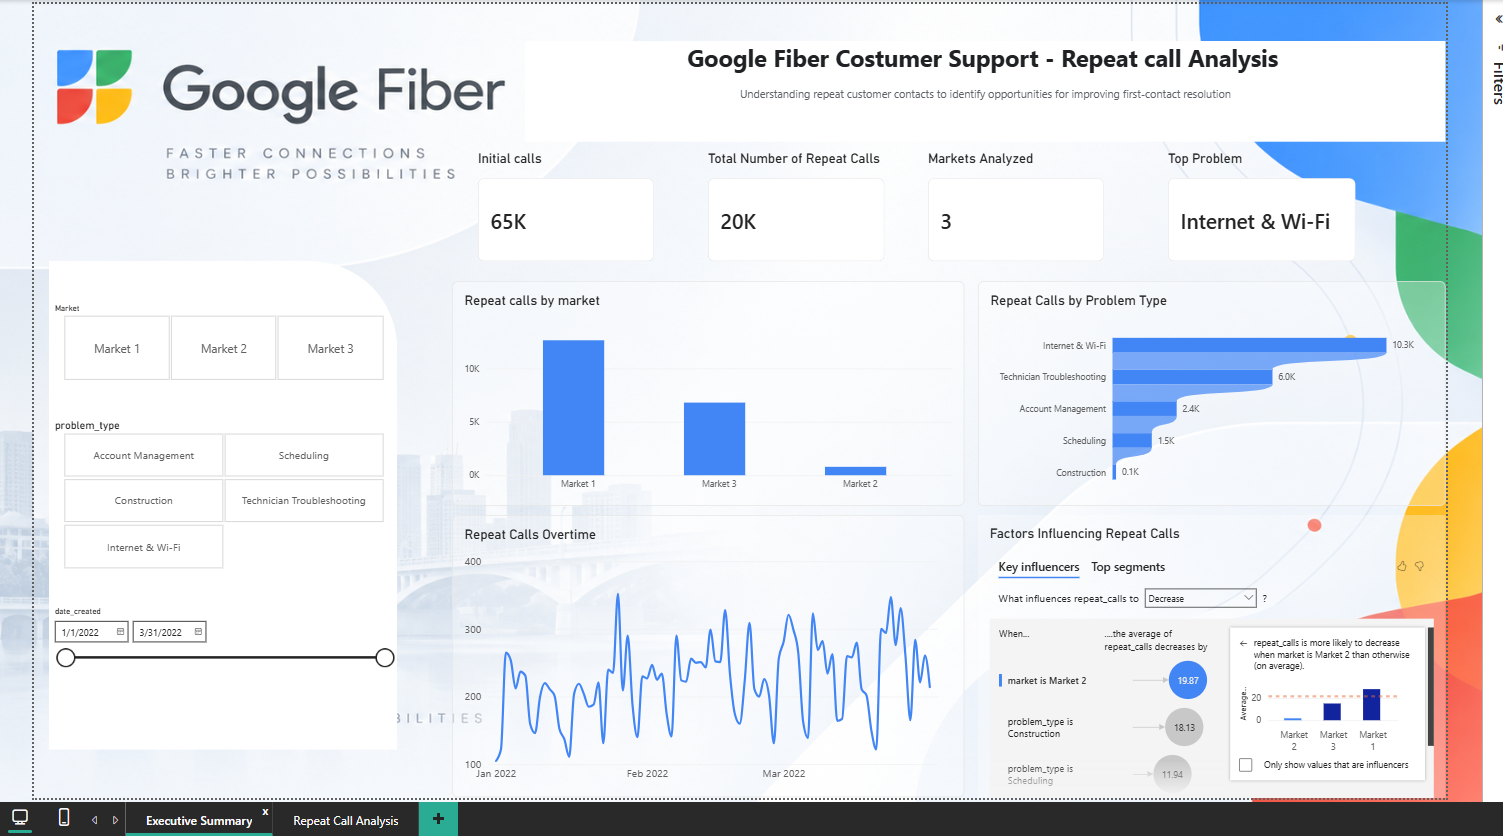
Google Fiber Repeat Calls Analysis

Google Fiber’s customer service team wanted to reduce repeat calls and improve first-contact resolution. I built an interactive BI dashboard tracking repeat calls across 3 market cities and 5 problem types, helping the team pinpoint why customers call back and where to focus improvements.

Power BIDocumentationExcelSQL

Overview

Google Fiber’s customer service team wanted to reduce repeat calls and improve first-contact resolution. I built an interactive BI dashboard tracking repeat calls across 3 market cities and 5 problem types, helping the team pinpoint why customers call back and where to focus improvements.

Google Fiber Repeat Calls Analysis

What I've accomplished

- Combined and cleaned call data from 3 markets into one dataset using SQL - Tracked repeat calls from day 1 to day 7 after the first contact - Broke down repeat calls by market, problem type, and time period - Designed KPIs to measure first-contact resolution - Built an interactive dashboard with filters for stakeholders

Outcome

Delivered a stakeholder-ready dashboard that gives the customer service team a single source of truth for repeat calls, helping them spot high-risk problem types and markets fast. Strengthened my skills in BI dashboard design, KPI development, and turning operational data into data-driven decisions.

View all work

✅ Verified by Extern · ⏱️ In progress

Amazon Operational Strategy & People Analytics Externship

Imagine shaping how AMAZON — yes, THE Amazon — welcomes and keeps its workforce. Every year, Amazon loses billions because new hires leave before Day 90. You’re going to fix that. In this externship, you’ll web scrape real-world employee reviews from across the web, extract actionable insights, and design persona-driven strategies to help Learning Ambassadors connect smarter, faster, and more humanely. It’s part research, part strategy—and all about learning how people data drives big decisions.

Data AnalysisPythonStrategyOperations

Overview

The externship combined operational strategy and people analytics to investigate early-career attrition at Amazon fulfillment centers. The work gathered and analyzed employee feedback sources, extracted patterns across roles and tenure, and translated those patterns into persona-driven recommendations. Deliverables included scraped review datasets, coded thematic findings, and candidate personas.

Amazon Operational Strategy & People Analytics Externship

What I've accomplished

I produced a structured workforce table that listed FC roles, reporting links, responsibilities, and tools used for Learning Ambassadors, pickers, packers, stowers, managers, technicians, and support roles.

Project breakdown

The project mapped FC roles and reporting links, listed responsibilities, tools used, and why each role mattered. I produced a structured workforce table covering Learning Ambassadors, pickers, packers, stowers, managers, technicians, and support roles.

Google Sheets
Access

I collected 10 public YouTube videos, extracted or linked transcripts, cleaned noisy text, and added columns for video title, tone, topic and metadata. The finished sheet produced a CSV-ready dataset of worker feedback for analysis.

Google Sheets
Access

I cleaned raw Glassdoor and YouTube text, generated keyword charts and word clouds, added sentiment scores with polarity labels, and combined both datasets to compare trends. The analysis found long, tiring shifts as a shared theme and showed Glassdoor reviews were more opinionated while YouTube…

Google Docs
Access
View all work