
Aug 2026
Dubai Real Estate Analysis
Dubai's real estate data was fragmented across off-plan, secondary, and rental sources, making it hard to compare investment opportunities or identify pricing drivers consistently.
Amazon Externship via Extern
Amazon Externship via ExternI build end-to-end data projects — cleaning, modeling, and visualizing data in SQL, Python, Tableau and power BI to turn raw datasets into decisions worth acting on.
Data projects built in SQL, Python, Power BI (DAX, Power Query), and Excel — from raw data cleaning and modeling to dashboards that drive real decisions.
Aug 2026
Dubai's real estate data was fragmented across off-plan, secondary, and rental sources, making it hard to compare investment opportunities or identify pricing drivers consistently.
Sep 2026
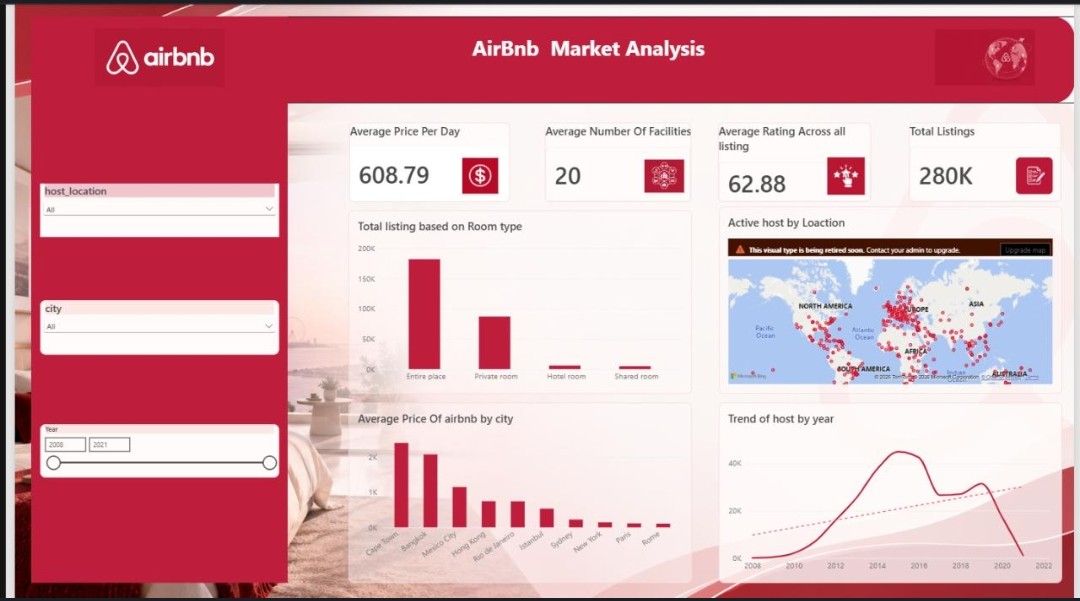
Airbnb's global listing portfolio is mature and scaled, yet averages just 62.88/100 in guest satisfaction. The goal was to identify which attributes actually drive satisfaction.
Sep 2026
A telecom provider needed to understand which markets and issue types were driving repeat customer support contacts, to prioritize first-contact-resolution improvements
Jun 2026
A UK rail ticketing dataset needed to be turned into an interactive view of revenue, delays, and customer behavior to support operational decision-making
Jul 2026
Personal streaming history spanning over a decade sat as raw, unstructured data with no visibility into long-term listening trends or preferences.
Aug 2026
A global electronics retailer needed visibility into profit drivers, customer retention, and operational gaps hidden across its product categories and regions.
Aug 2026
A fictional airline was receiving a high volume of dissatisfied customer reviews. The goal was to uncover the root causes behind the dissatisfaction using service and delay data.
Jun 2026
Vaccination data was being processed and reported manually, creating delays and inconsistency. The goal was to automate the pipeline for faster, more reliable reporting.
Jun 2026
A multi-country retailer needed a unified executive view of sales and profit performance across regions and currencies to support strategic decisions.
May 2026
A wellness tech company wanted to understand user engagement and health patterns from fitness tracker data to improve its smart device offerings and marketing campaigns.
May 2026
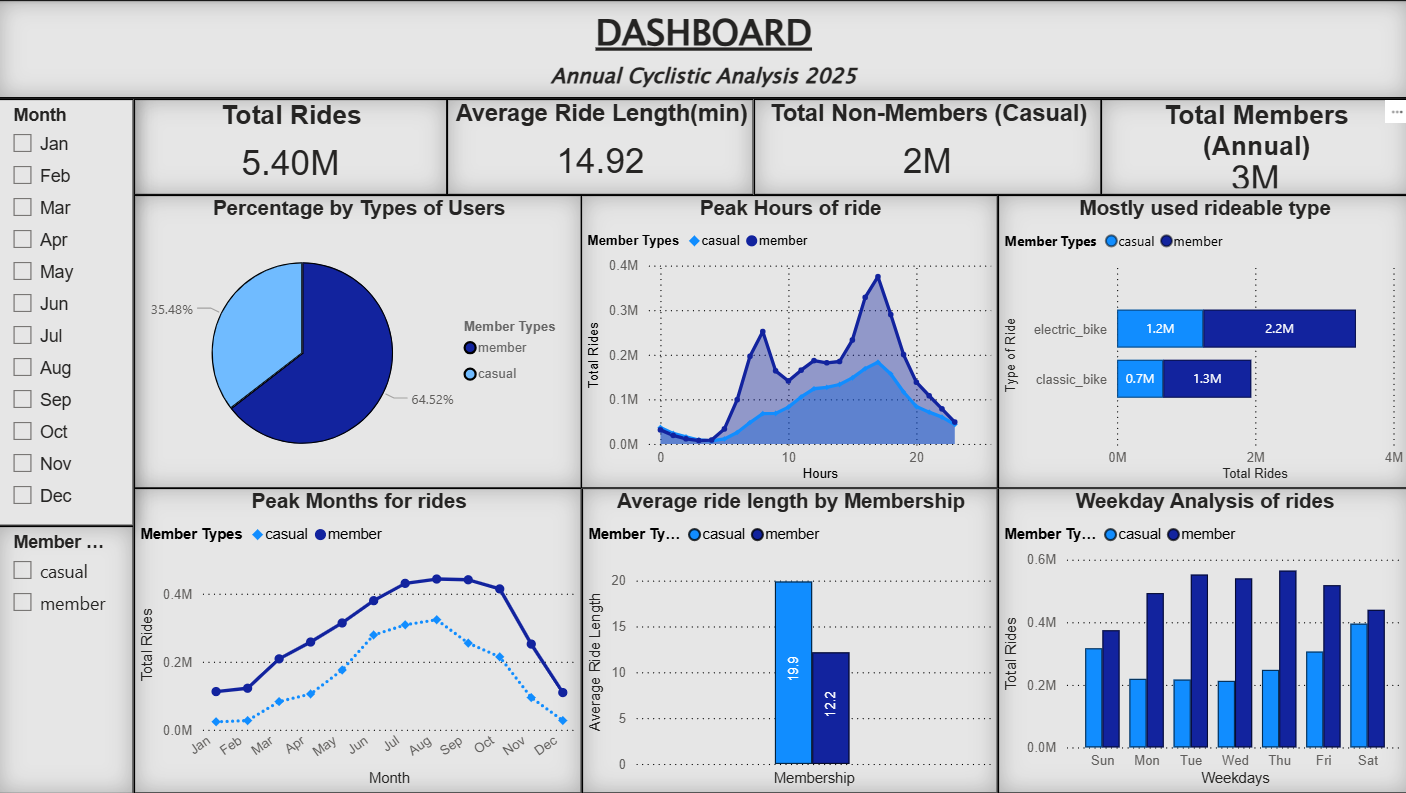
A ride-share company needed to understand how casual riders differ from annual members to design a membership conversion strategy. I analyzed 5M+ Divvy bike-share trips to uncover behavioral patterns that could inform targeted marketing.
Amazon · ✅ Verified by Extern · ⏱️ In progress
Imagine shaping how AMAZON — yes, THE Amazon — welcomes and keeps its workforce. Every year, Amazon loses billions because new hires leave before Day 90. You’re going to fix that. In this externship, you’ll web scrape real-world employee reviews from across the web, extract actionable insights, and design persona-driven strategies to help Learning Ambassadors connect smarter, faster, and more humanely. It’s part research, part strategy—and all about learning how people data drives big decisions.
I build end-to-end data projects — cleaning, modeling, and visualizing data in SQL, Python, Tableau and power BI to turn raw datasets into decisions worth acting on.
I'm Syed Taha Ahmad, an entry-level Data Analyst based in Dubai, UAE, with a B.Tech in Computer Science and Engineering. I work across SQL, Python, R, Power BI, Tableau, and Excel, and hold Microsoft PL-300,Google Business Intelligence and Google Data Analytics Certifications. My portfolio includes 11 end-to-end projects spanning real estate, hospitality, retail, and customer support data, each tracing a business question to a measurable finding. I'm currently in an Amazon-sponsored people analytics externship through Extern, applying sentiment and thematic analysis to real employee feedback.
Externships
Amazon Operational Strategy & People Analytics Externship
In progress
Education
Allenhouse Institute of Technology (affiliated with AKTU), Uttar Pradesh, India
B.Tech, Computer Science & Engineering · Class of 2025
Skills
Aug 2026
Dubai's real estate data was fragmented across off-plan, secondary, and rental sources, making it hard to compare investment opportunities or identify pricing drivers consistently.

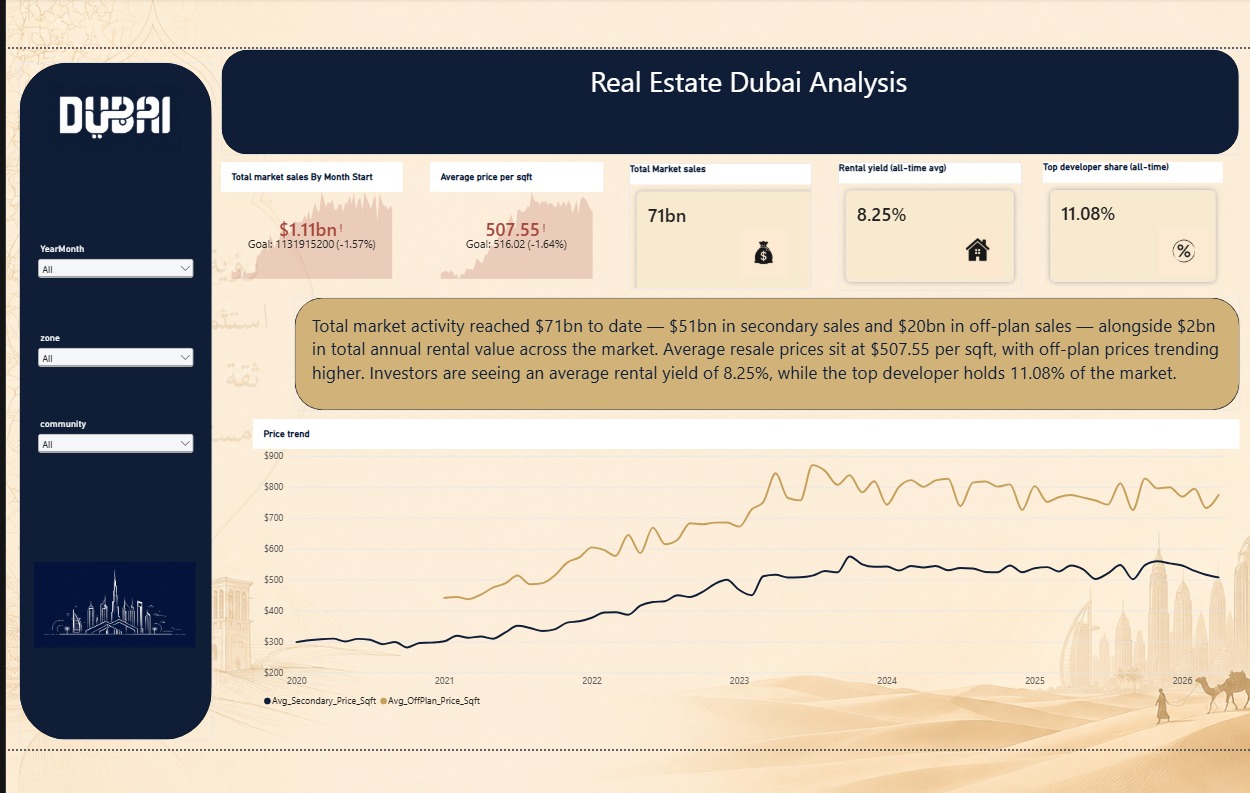
Integrated 5 data sources (93,000+ listings) into a star-schema Power BI model, engineering gross rental yield, metro-proximity segmentation, and normalized price-per-sqft to enable cross-market comparison.
Tracked $71B in market activity and found freehold ownership drives a 97% price premium — larger than metro accessibility's effect — while surfacing high-growth, high-yield communities outperforming prime locations.
Sep 2026
Airbnb's global listing portfolio is mature and scaled, yet averages just 62.88/100 in guest satisfaction. The goal was to identify which attributes actually drive satisfaction.

Cleaned 279,713 listings and 5.37M reviews in MySQL, standardizing 662 inconsistent host-location values and engineering an amenity-count field, then ran Key Influencers analysis in Power BI.
Found cleanliness, accuracy, and communication were the strongest statistical drivers of review score, well ahead of price or location — showing scale hadn't translated into guest satisfaction.
Sep 2026
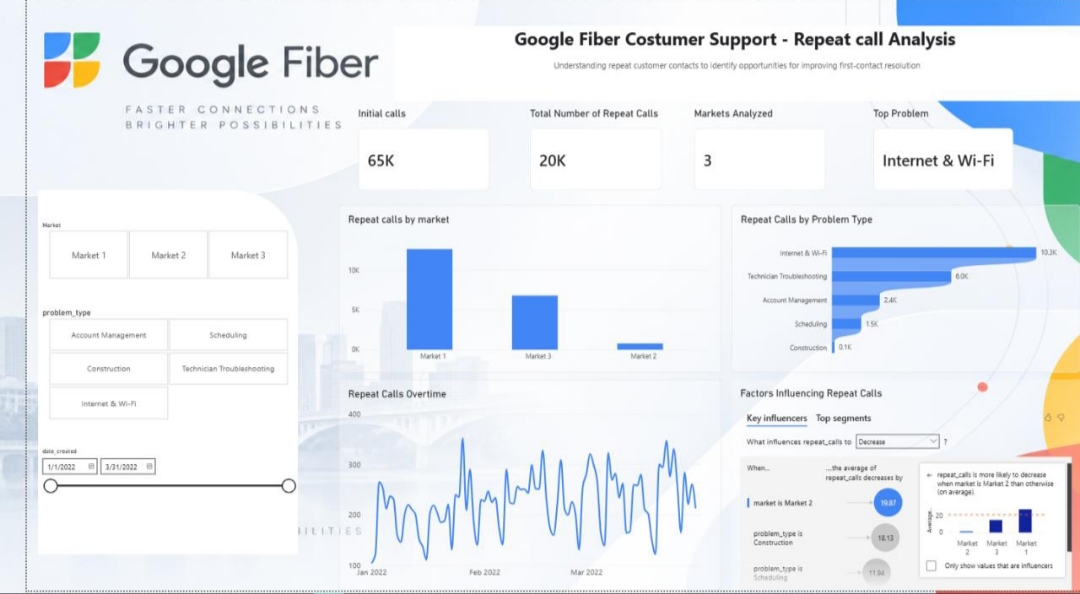
A telecom provider needed to understand which markets and issue types were driving repeat customer support contacts, to prioritize first-contact-resolution improvements

Combined and cleaned 3 datasets (450 rows) in BigQuery into a 1,350-row analysis-ready table, then built an interactive Power BI dashboard with market, problem-type, and time-period filters.
Found 20,240 repeat calls from 65K initial contacts (~31%), with Market 1 driving ~63% of them, mainly Internet & Wi-Fi issues — recommending first-contact-resolution training there as the priority fix.
Jun 2026
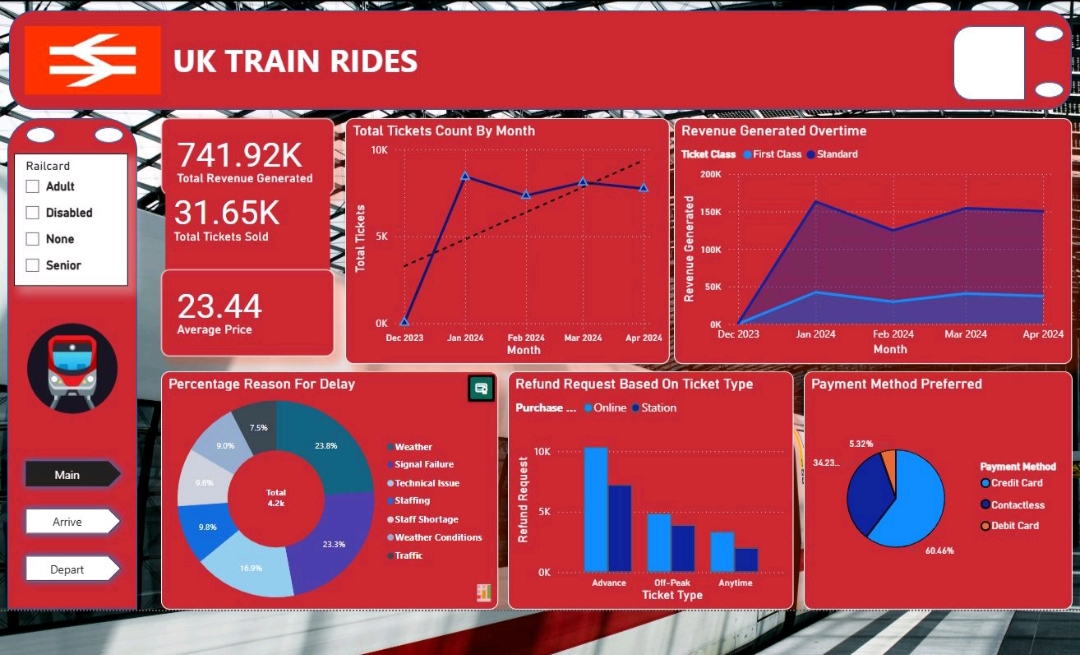
A UK rail ticketing dataset needed to be turned into an interactive view of revenue, delays, and customer behavior to support operational decision-making

Structured and modeled 60,000+ ticketing records in Power BI, building DAX-driven KPIs for revenue and sales trends alongside interactive slicers for delay causes, payment methods, and refund patterns.
Delivered a dashboard breaking down delay causes (weather, technical faults, staffing) and refund patterns by ticket type and purchase channel, providing actionable KPIs for operational teams.
Jul 2026
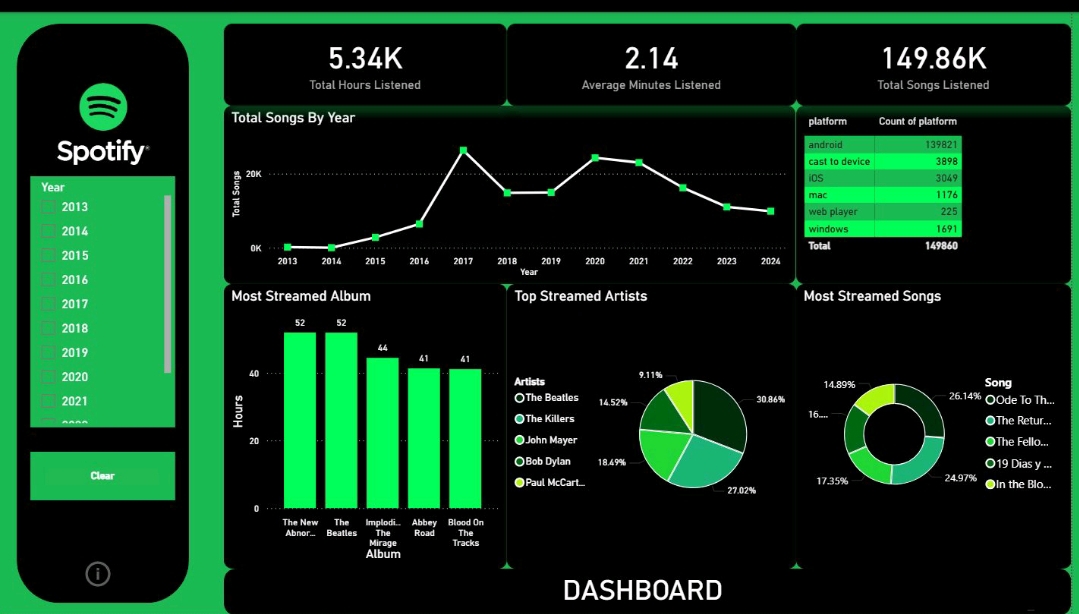
Personal streaming history spanning over a decade sat as raw, unstructured data with no visibility into long-term listening trends or preferences.

Cleaned and structured ~150,000 streaming records from 2013–2024, converting play duration into minutes/hours and building DAX measures to power an interactive dashboard with ranking charts and platform breakdowns.
Surfaced 5,000+ hours of total listening time, year-over-year trends across 11 years, and top artists, albums, and tracks by listening share, segmented by platform.
Aug 2026
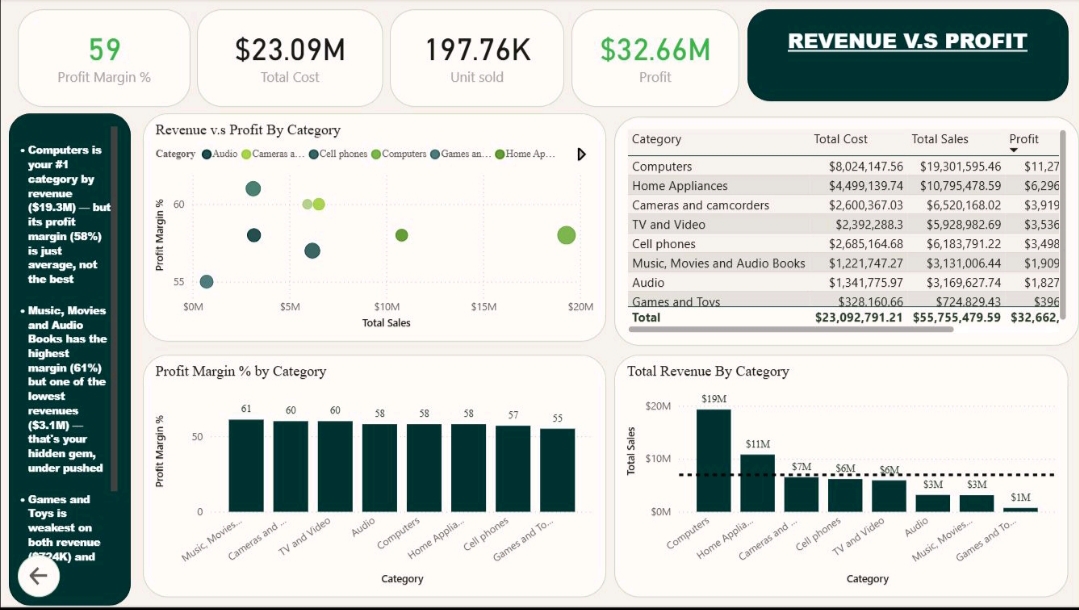
A global electronics retailer needed visibility into profit drivers, customer retention, and operational gaps hidden across its product categories and regions.

Built a star-schema Power BI model with sales as the central fact table, applying feature engineering and EDA to analyze profitability, retention, and delivery performance across categories and demographics.
Found Music/Movies/Audio Books carried a 61% margin despite low revenue, customers 50+ drove $30M in sales, and 79% of orders were missing delivery status — flagged as the most urgent data-quality issue.
Aug 2026
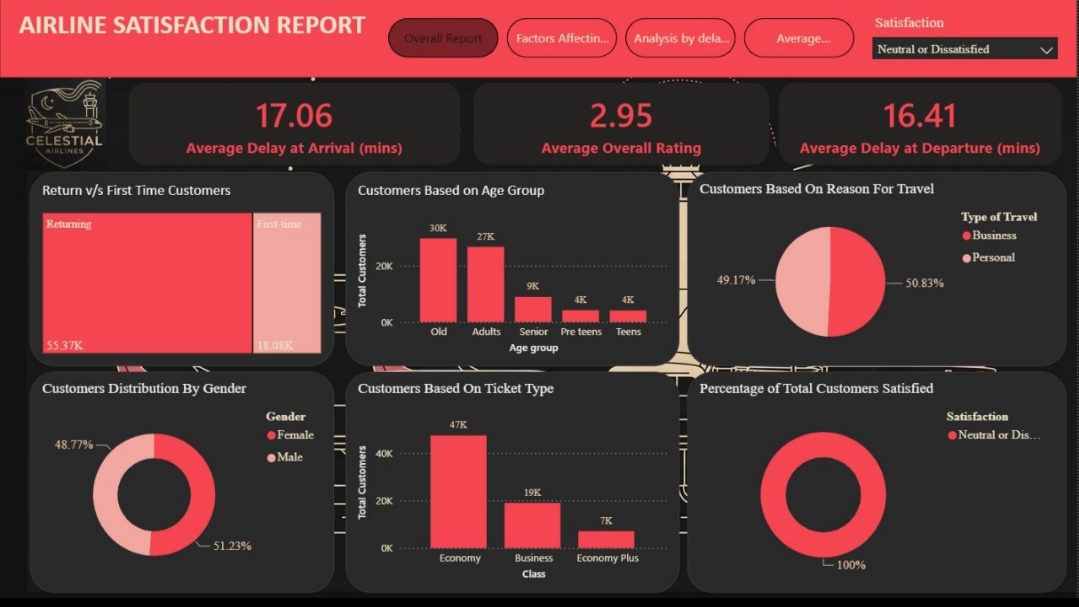
A fictional airline was receiving a high volume of dissatisfied customer reviews. The goal was to uncover the root causes behind the dissatisfaction using service and delay data.

Built a Power BI dashboard analyzing ratings, delays, and customer segments, using key visuals to isolate which services and conditions most affected satisfaction scores across ticket classes.
Found over 57% of customers dissatisfied, with online services the main bottleneck; satisfaction fell with delays but rose with flight distance. Set a 3.6+ average rating as the improvement target.
Jun 2026
Vaccination data was being processed and reported manually, creating delays and inconsistency. The goal was to automate the pipeline for faster, more reliable reporting.
Built a cloud ETL pipeline on AWS using S3, Glue, and QuickSight to automate the collection, transformation, and visualization of vaccination data end-to-end, replacing manual handling with a scheduled workflow.
Delivered live dashboards fed by an automated pipeline, removing manual reporting steps and reducing the turnaround time between raw data and usable insight for stakeholders.
Jun 2026
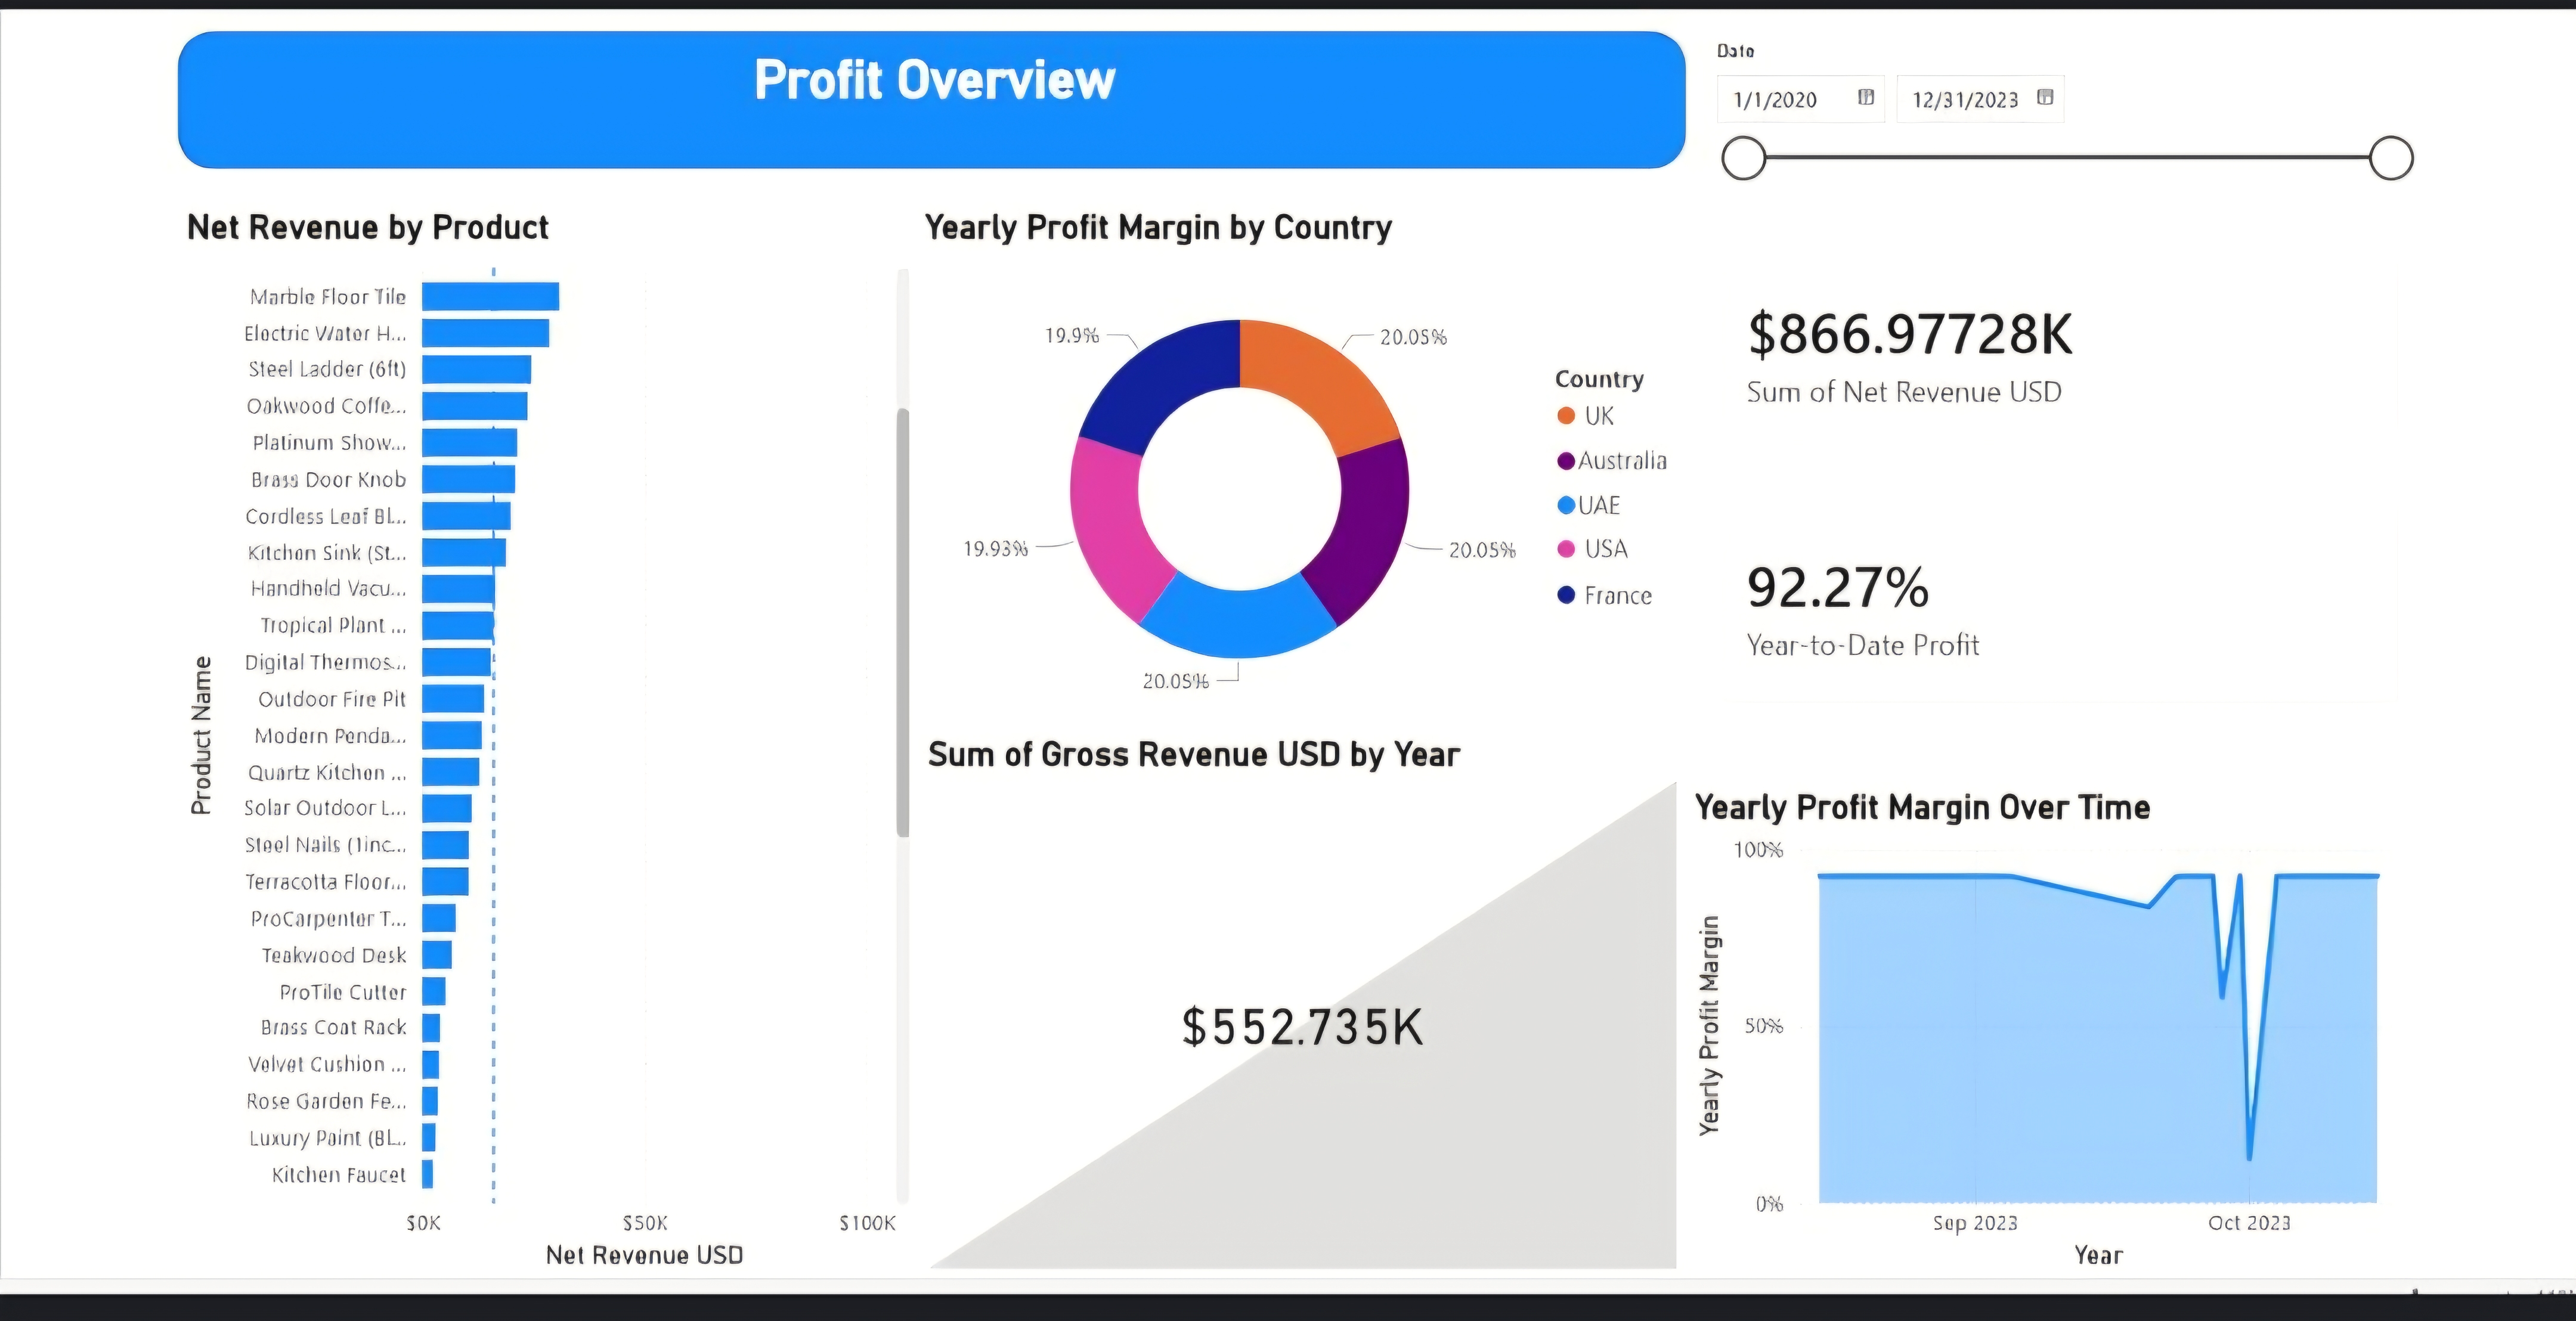
A multi-country retailer needed a unified executive view of sales and profit performance across regions and currencies to support strategic decisions.

Built a 5-table relational data model in Power BI spanning 5 countries and 14 product categories, with DAX measures for Sales in USD, YTD Profit Margin, and Median Sales to standardize multi-currency reporting.
Delivered a dashboard tracking $866.97K net revenue and 92.27% YTD profit, revealing the UAE drove 63.49% of median sales while margins stayed near 20% consistently across all regions.
May 2026
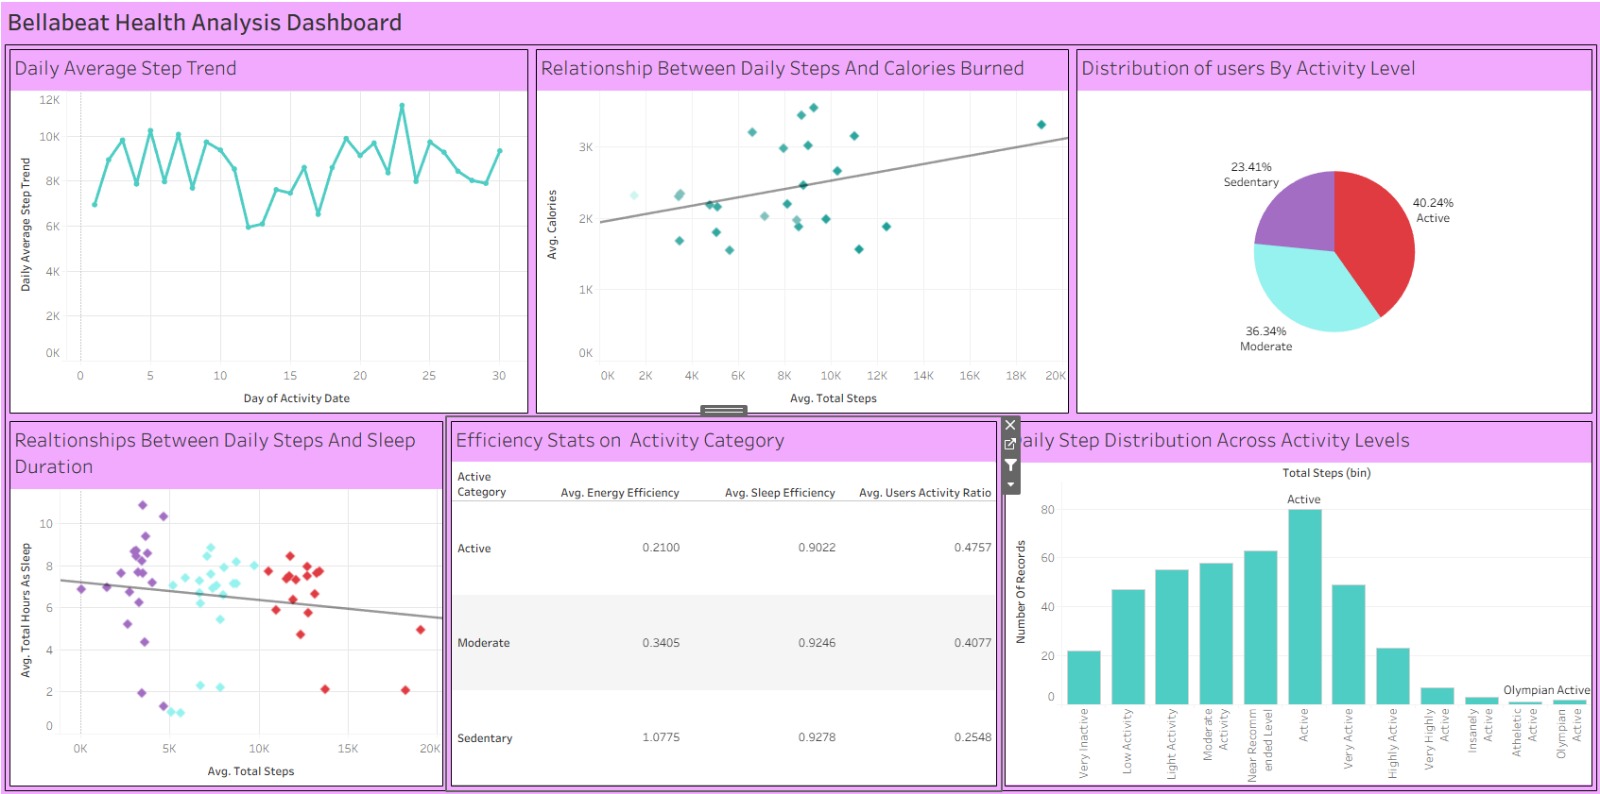
A wellness tech company wanted to understand user engagement and health patterns from fitness tracker data to improve its smart device offerings and marketing campaigns.

Examined 940,000+ Fitbit activity records in SQL and Excel, cleaning raw data and running exploratory analysis to uncover patterns in activity levels, calorie expenditure, and sleep behavior.
Found highly active users burned 30–40% more calories, while 45% showed inconsistent activity and irregular sleep — insights used to recommend targeted wellness campaign segments.
✅ Verified by Extern · ⏱️ In progress
Imagine shaping how AMAZON — yes, THE Amazon — welcomes and keeps its workforce. Every year, Amazon loses billions because new hires leave before Day 90. You’re going to fix that. In this externship, you’ll web scrape real-world employee reviews from across the web, extract actionable insights, and design persona-driven strategies to help Learning Ambassadors connect smarter, faster, and more humanely. It’s part research, part strategy—and all about learning how people data drives big decisions.
The externship examined retention challenges in Amazon fulfillment centers by collecting and analyzing employee reviews and operational context. The work combined web-scraped employee feedback with operational research to surface patterns in early-tenure exits and to inform persona-driven strategies. Deliverables included analyzed review data, synthesized insights, and candidate personas.
.png)
I produced a role-by-role workforce spreadsheet that listed each position, main responsibilities, close collaborators, common tools, and explanatory notes.
Situation: the externship asked for a workforce map at an AFC. Task: catalog roles and their responsibilities. Action: compiled a spreadsheet listing roles, main responsibilities, who they work closely with, common tools, and notes. Result: produced a clean role-by-role workforce structure showing…
I gathered Glassdoor reviews and YouTube transcripts, cleaned encoding and label inconsistencies, removed empty/duplicate columns and rows, added tone and topic columns for videos, and exported final CSVs ready for analysis.
I cleaned and combined Glassdoor and YouTube text, scored sentiment with TextBlob, generated unigram/bigram/trigram charts and word clouds, and reported that Glassdoor leaned positive on pay while YouTube emphasized breaks, long shifts and physical strain.
I extracted themes and sentiment from Glassdoor and YouTube, tagged 520 rows with Python, identified Physical Strain & Footwear as the top negative theme, and built a 5 Whys analysis and root-cause tree showing system-level causes like productivity rates and weak feedback loops.
I grouped cleaned employee reviews into labeled segments (Core Production Associates, Contingent Labor, Leadership & Indirect Staff, High-Pace/Specialized Roles), documented theme counts per segment, and produced a CSV/worksheet showing friction frequencies by theme for each cohort.